JunoCam at Perijove-1: Animated maps showing jets and storms
Animated maps, derived from JunoCam images by Gerald Eichstädt, now show the circulation of cyclonic storms in the North Polar region, and the super-fast jet in the North Temperate region. Adjusted versions of these animations are shown here.
Gerald Eichstädt has processed the JunoCam pre-PJ1 images and projected them into maps, also applying a ‘de-Lambert’ formula to remove the brightness variation across the disk in each case. As one outcome of this very substantial and careful work, he has produced pairs of maps of particular northern regions which can be ‘blinked’ to show the wind patterns over short intervals.
Gerald used rigorous procedures for the projection and de-Lamberting, but the blink pairs show some residual offsets in position (probably due to inaccuracies in projection and possibly camera distortion) and in colour (probably due to non-linear response of JunoCam at low light levels; the images show little real colour contrast in the polar regions). I have produced versions with arbitrary tweaks, in which one image has been slightly rotated to put known stationary features into optimal register, and broad intensity gradients have been applied to produce more uniform colours and contrasts. Some artefactual distortions and colours remain, but the animation do show real winds clearly.
The posted animations are:
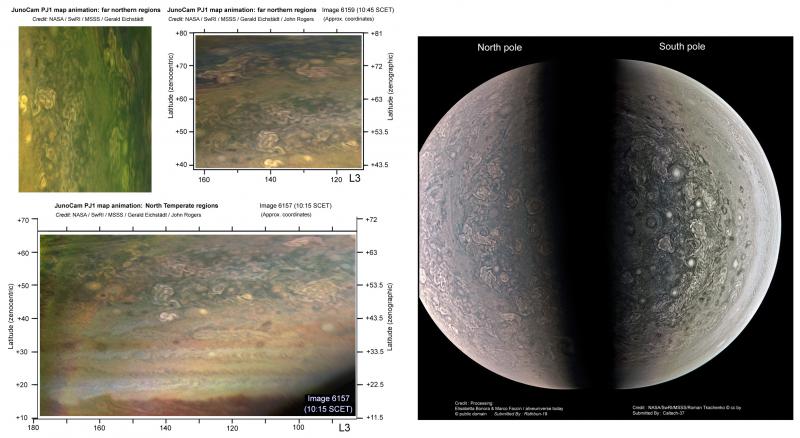
(1) High northern latitudes (43-80ºN), pair with an interval of 73 minutes, clearly showing the cyclonic (clockwise) circulation of the chaotic ‘folded filametary regions’ (FFRs). This is the first such short-term animation ever produced of these high-latitude features. TIt also shows prograde jets (blowing to the right) at ~55ºN and 67ºN (zenographic latitudes), which are the N5 and N6 jets known from previous spacecraft. (Three versions are posted: Gerald’s original, and my tweaked version, and an enlargement of 2 FFRs using the following image pair.)
(2) Mid northern latitudes (12-67ºN), including the N. Temperate region. There are 3 images at 30-min intervals, so real motions are very small, but several jets can be seen. Most important was the NTBs jet (23.7ºN) which would erupt in a spectacular outbreak just a few weeks later. I estimate its motion as 3.5 (±0.8) pixels (0.35 deg) in 60 mins, i.e. -8.4 (±1.7) deg/day relative to features stationary in L2, indicating that the jet had not yet accelerated up to the full ‘outbreak’ speed of -13 deg/day.
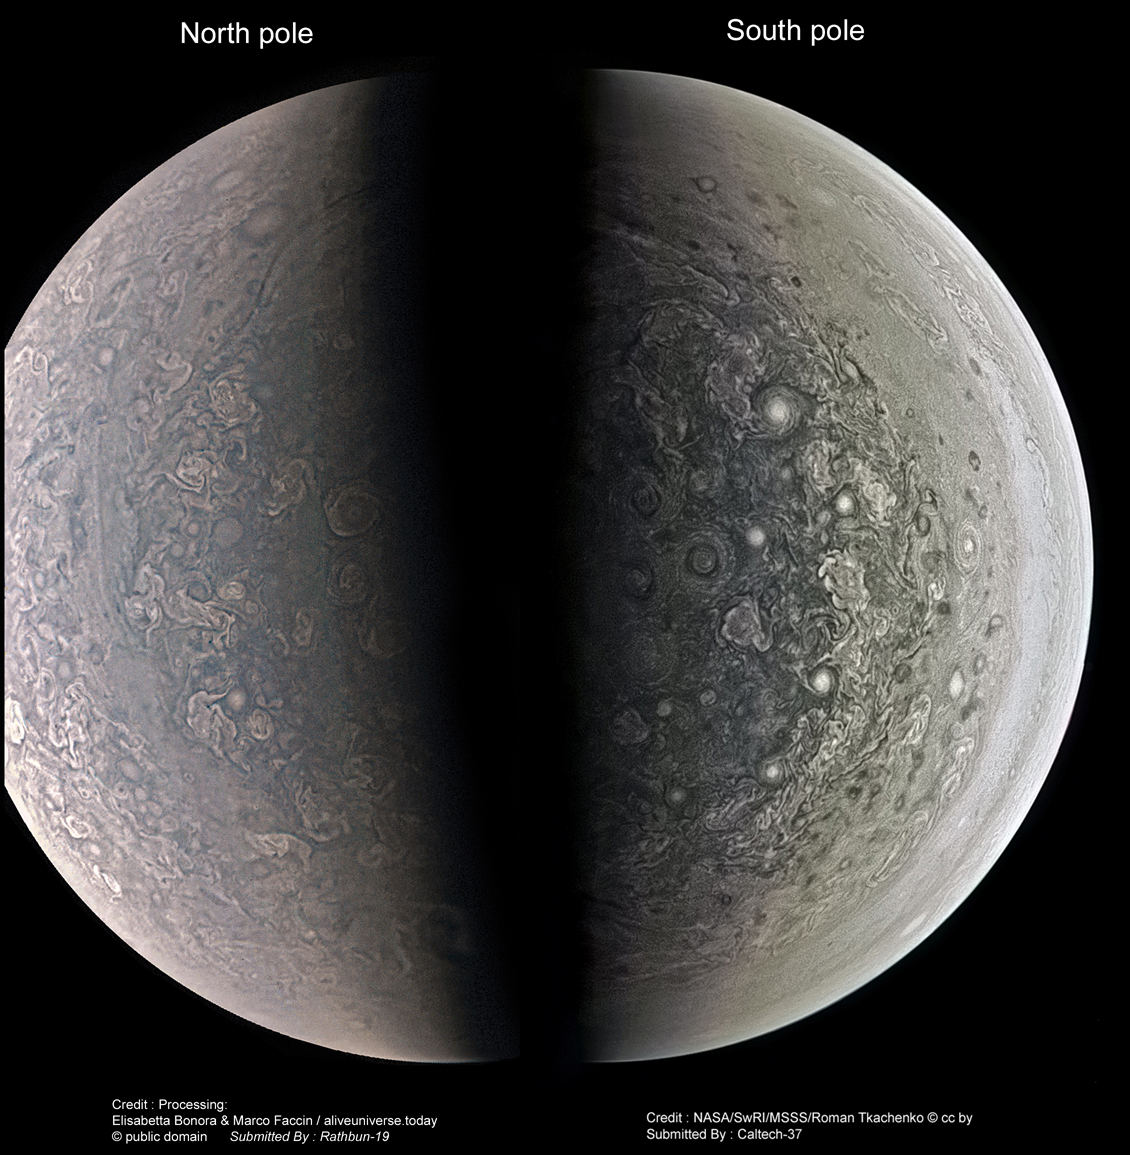
The final post is a composite of the views directly over the north and south poles as produced by the JunoCam team and improved by other amateur processors on the JunoCam web site, as indicated. This is a larger version of the small figure published in the Journal of the BAA (2016 Dec., p.333).
| The British Astronomical Association supports amateur astronomers around the UK and the rest of the world. Find out more about the BAA or join us. |