› Forums › Spectroscopy › First spectra post Alpy workshop!
- This topic has 9 replies, 3 voices, and was last updated 7 years, 5 months ago by
 Steve Cuthbert.
-
AuthorPosts
-
4 November 2016 at 8:28 pm #573626
 Steve CuthbertParticipant
Hi guys
Well back to normality after the workshop and hopefully my newly tweaked Alpy will perform how it should.(not sure about the owner!)
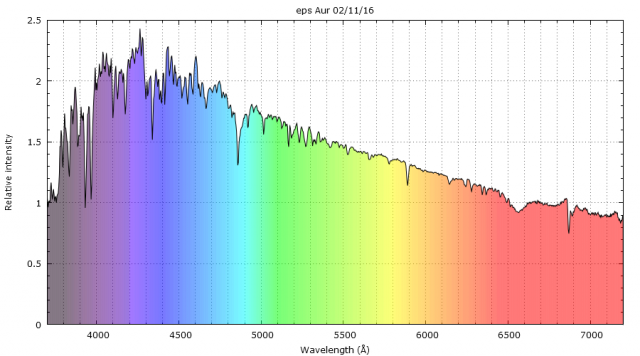
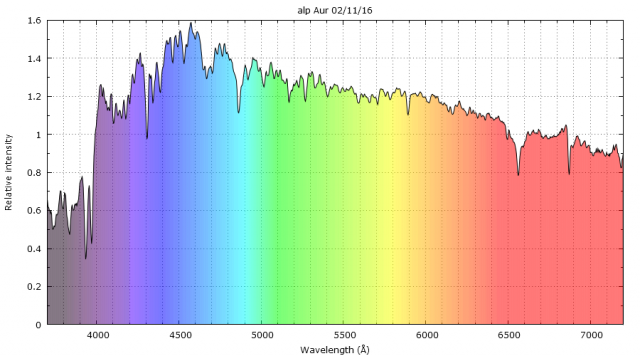
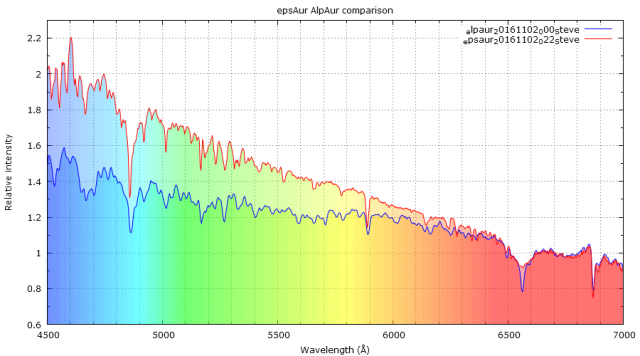
Tried some shots the other night (1st/2nd Nov) with a couple of random stars (alpha Aur and eps Aur) really should have waited for better conditions as pretty hazy sky but impatience wins the day ;-).
Files
flats 20x12secs
darks 20x5mins
bias 20×0.001secs
reference lamp 120 secs
Sinbad tells me that eps Aur is an A9I type star but none available in ISIS library so used a A9III from Miles for the response which seemed to be ok. After inputting all the files came up with a healthy RMS of 0.121. Now since installing Isis 5.7.0 there seems to be some issue with Gnuplot as it runs ok but for some reason Ymin on the graph defaults to 0 regardless of what you tell it, hopefully Francois`s new software should display it better, (not sure if it includes Gnuplot??).
Seems to use a different Ymin when you plot two curves ???
Shame about the Ymin as it would make the plot better. Scripts for the colouring kindly given to me by Thomas at the workshop!. Cheers Thomas (hope I`ve remembered your name ok!)
Couple of thoughts I had doing this :-
If Isis library stars are used to calculate response why would we use other stars to create fresh spectra for calculating response?. (Sure I used to know this maybe the grey matter is not what it was ;-))
Normalising- how/when do we use it with ISIS?. Is it just used for comparison?.
After discussing the merits of using Flats with Robin at the workshop it certainly seems to make a difference as I don`t remember achieving an RMS of 0.121 before.
Comments/advice/criticism most welcome chaps
clear skies
Steve
Attachments:
4 November 2016 at 9:49 pm #577592 Robin LeadbeaterParticipant
Hi Steve,
I am not sure I follow what you have done.
To calculate the instrument response using a MILES star, you take a spectrum of the actual MILES star you have chosen, not one which happens to have the same spectral class. (The actual spectral class does not matter as long as it is a hot star, it is probably unreliable anyway!) That way you end up with a spectrum of the MILES star as measured with your equipment which you can directly compare with the one of the same star in the library, which was measured and calibrated by a professional. The ratio of the two is your instrument response.
You can then use this instrument response to correct a spectrum of any target measured using your setup, (even if you have no idea what the spectrum will look like) to produce a fully calibrated spectrum. (With one caveat – you should chose a MILES reference star at similar altitude to your target so the effect of atmospheric extinction is the same.)
Cheers
Robin
4 November 2016 at 10:11 pm #577593Robin LeadbeaterParticipantUnless you have calibrated your flux (The Y axis) in physical units rather than just counts from the camera (which are meaningless to anyone else but you) you should always scale your spectrum in relative flux so the continuum equals 1 on average over some chosen wavelength range. ISIS does this automatically during processing.The wavelength range is your choice and can be set in ISIS under “settings” “profile domain for spectral scaling” This is also sometimes called Normalising eg in ISIS under “Profile” “Normalize” where you can also scale any spectrum in the same way.
“Rectification”, sometimes confusingly also called “Normalising” is a further step where the continuum is effectively removed to make a level spectrum where the continuum equals 1 everywhere. This obviously loses information (the shape of the continuum) so you would only do this step if you specifically needed to do so for a particular analysis. The non rectified spectrum is the one which you would publish in a database for example.
Calibrating the Y axis in absolute physical units rather than in relative flux is an advanced topic which is probably best left until you are comfortable relative flux calibration.
Cheers
Robin
4 November 2016 at 11:20 pm #577594Robin LeadbeaterParticipantEps Aur is not really a good choice as a reference star. It is a famous long period eclipsing binary but is not particularly typical even outside eclipse. Using Brian Skiff’s huge database of published spectral classifications
http://vizier.u-strasbg.fr/viz-bin/VizieR?-source=B/mk
we can see it has been classified as anything from F4i to A8i. (A hotter star would be better as it would have fewer lines)
It is also a pulsating variable star and shows varying H alpha in emission for reasons which are not exactly clear. The spectrum also has significant interstellar lines so the continuum shape may be affected by interstellar extinction. Main sequence (luminosity class v) stars are generally a better choice as reference stars as they are less likely to be variable and more likely to be typical of their spectral classification though this cannot be guaranteed unless (like the MILES stars) there is a reliable calibrated spectrum for it.
Cheers
Robin
4 November 2016 at 11:29 pm #577595Steve CuthbertParticipantHi Robin
I was trying to follow step by step like we did at the workshop, take a spectrum of a target star and use a similar class of star in the ISIS library for the response. Must admit I do get confused when to take a reference star`s spectrum and when a library one.
I do remember now to use an A or B type for response, my bad !!. Those spectra above are simply the result of using an A9III Miles library star for the response which is obviously incorrect, Think that RMS got the better of me 😉
thanks for that!
Steve
4 November 2016 at 11:35 pm #577596Steve CuthbertParticipantJust realised what I`m supposed to be doing now (call it a grey moment!).
Take a reference spectrum of an A or B star which is then divided by an equivalent library spectrum to give a response curve which is then used as the response for the target spectra, yes its coming back now ;-))
Sorry
Steve
5 November 2016 at 12:00 am #577597Robin LeadbeaterParticipantHi Steve,
gnuplot seems to be working ok for me with ISIS 5.7.0. (see attached quick example)
Do you have auto scale unchecked on the single plot?
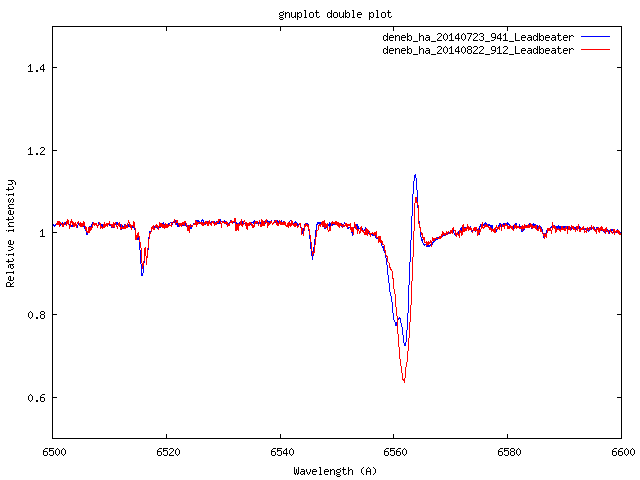
The Y scales cannot be set independently in the double plot so it just plots the spectra as they have been scaled in processing. Your two spectra appear to be scaled to1 near H alpha which is where they match. The hotter of the two stars (eps Aur) then rises faster towards the blue end as would be expected) You could try rescaling them at 5000A say using the “profile” “normalize” function when they will cross closer to the middle of the spectrum.
There are more sophisticated plotting tools around though. For example Tim Lester has recently posted one he is developing on the ARAS forum
http://www.spectro-aras.com/forum/viewtopic.php?f=8&t=1596
Robin
5 November 2016 at 11:38 am #577598 Tony RoddaParticipant
Great plotting tool. Simple, elegant.
V useful. Thanks Robin.
Silly, I know, but just plying with it…
 5 November 2016 at 12:06 pm #577599Tony RoddaParticipant
Steve,
Good progress. Nice to see the same pitfalls as me!
Regards
T
5 November 2016 at 5:01 pm #577603Steve CuthbertParticipantHi Tony
`Pitfalls` seems to be a new hobby for me as well as `b$lls ups` all part of the fun(?) 😉
cheers
Steve
-
AuthorPosts
- You must be logged in to reply to this topic.