› Forums › Spectroscopy › How to validate observations
- This topic has 8 replies, 3 voices, and was last updated 6 years, 1 month ago by
Keith Shank.
-
AuthorPosts
-
13 June 2020 at 9:55 pm #574644
Keith Shank
SpectatorHello!
I am a newcomer to both the BAA and to Spectroscopy. As my backyard observatory here in the Dallas Texas area has become fairly useless for any deep sky imaging, I have made the jump into spectroscopy. I have a C14Edge @ f/7 on an AP1200 and have acquired a LISA, using a 35u slit (figure easier to learn with), a ATIK 414EX imaging camera, and STI guiding camera. The LISA has the calibration module, a SPOX for remote control, and I run it from TheSKYX.
I have been learning how to acquire and do the analysis of the spectrum by using Demetra and watching the videos done by Shelyak. But it is self directed and self learned, and as the saying goes, learn from a neophyte and the results will be beginner at best.
Is there anyone in the BAA in the DFW area that is experienced in acquisition and analysis of spectroscopic data especially using a LISA or similar?
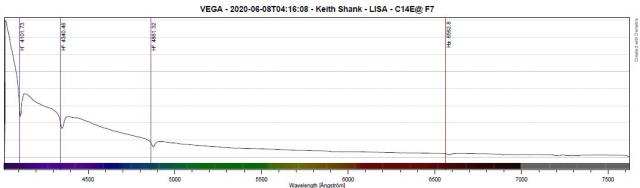
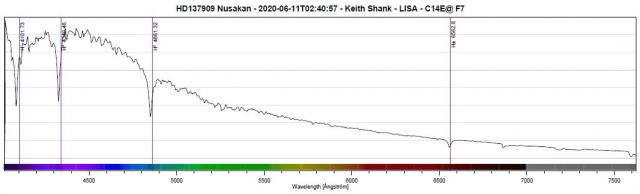
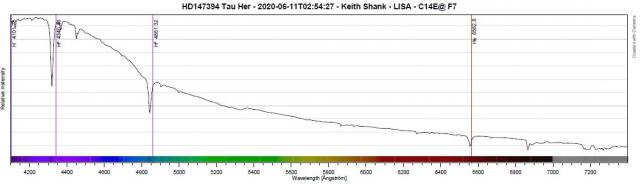
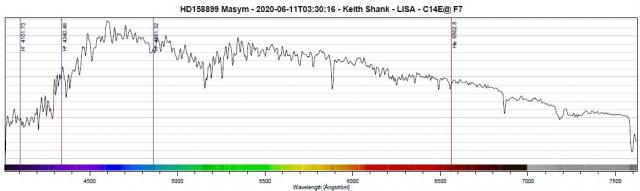
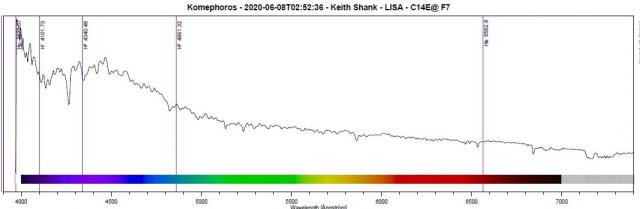
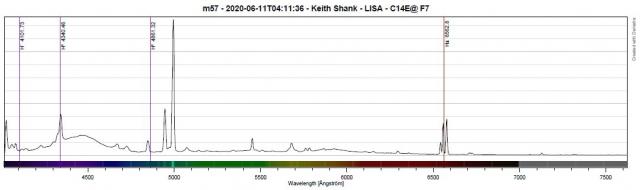
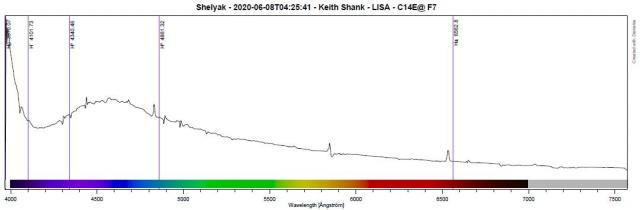
Some of my results below, I am hoping to get this process much better so I can successfully support long term and alert measurement requests.
Not sure how to get feedback perhaps there is a formal way to do this in the group, if so please advise and thanks for any guidance. I particularly have question on the response section of the process, try to use either Pickles star (for stars) when they exist or do I use my own shots of the stars, but calibrate (e.g., Vega) those against the Pickles standards? I have looked at the BAA database and my data looks ‘similar’ but.. different, so I know I am not doing it exactly right.
Thanks for any help or direction (note: I have read and used e book Practical Guide to Spectroscopy -Francois Cochard, but sometimes good information does not sink in all the way…
Keith

 13 June 2020 at 9:57 pm #582638Spectator
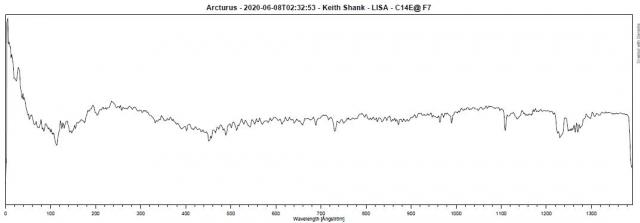
NOTE: The Arcturus image was before calibration, n it got put in by mistake so please ignore.
14 June 2020 at 9:55 am #582639 David BoydParticipant
Hello Keith,
Welcome to the exciting (and challenging) world of spectroscopy! You are clearly well-equipped. There are some useful resources on the BAA Equipment and Techniques section webpages at https://britastro.org/node/19378. Francois’ book is also a good resource and a good guide for a beginner to get up to speed.
There is an active online discussion group on spectroscopy mainly based in the US but including some of us in the UK which is coordinated by Woody Sims in Phoenix. Several of us now have LISA spectrographs. I will ask Woody to make contact with you.
It looks from the spectra you have posted that you have some problems with wavelength calibration as the Balmer lines in your spectra do not always lie at the correct wavelengths. I have been using Christian Buil’s ISIS software to process my spectra for a long time but have just started looking at Demetra. It has a good facility for checking how well it is locating the lines in your calibration spectrum so it is worth spending some time working with that. You should be aiming for an rms value of around 0.1 with a LISA. Make sure your LISA is well focused and that you are not saturating the lines in the calibration image.
So try to master wavelength calibration first then move on to response correction. This involves taking the spectrum of a reference star whose spectrum you can find in a library and using that to generate a smooth response profile which will enable you to correct the spectrum of another star for atmospheric and instrumental losses. The reference star should be close in airmass (=altitude) to your intended target star so the atmospheric correction will be the same. You can find spectra of possible reference stars in the MILES library (these are actual measured spectra) or in the Pickles library (these are synthetic spectra of the main spectral types). There is a useful spreadsheet which will give you a list of possible MILES reference stars close to a specific location in the sky at a specific time here
http://www.spectro-aras.com/forum/viewtopic.php?f=8&t=941
Try to pick stars which are main sequence stars (spectral class V) and have spectral types B or A as these have spectra with a smooth continuum which makes it easier to generate a smooth response profile in Demetra.
There is also a lot of information available on the ARAS spectroscopy forum at http://www.spectro-aras.com/forum/index.php and that is also a good place to ask questions as many active spectroscopists use it.
That’s probably enough information to keep you busy for now. It’s good to have you in the amateur spectroscopy community. There is much useful work to be done.
Best wishes,
David
15 June 2020 at 4:23 pm #582642SpectatorDavid,
Thanks very much for the kind response and good information. Yes exactly the Balmer lines were not in the right location, I think your response just gave me the insight I needed to move forward. I was mis-using the software as I suspected. Ok so take my data of the reference star and use the on-line resources to create a smoothed instrument result. I was using the on-line resource to create that smoothed result directly. At least that is the first step, and explains the impact. Also getting an idea of the right RMS value is of great help! More to learn for sure, and will always appreciate guidance.
Also thanks for the connection to Woody, he has already contacted me, and I am very happy to have that connection!
Glad to be a beginner part of this group, looking forward to future growth here!
Regards,
Keith
17 June 2020 at 8:07 pm #582646 Robin LeadbeaterParticipant
Hi Keith,
David mentioned MILES stars. I find a good way of checking the quality of ones observations is to measure a few of these stars and compare the results directly with the spectra as measured professionally. Any differences can then be investigated and once they are close to the professional version one can confidently submit spectra of other targets to the BAA database for example. You can see an example of this sort of test here using the ALPY 600.
https://britastro.org/node/8153
and there are more examples and further information here on my website
http://www.threehillsobservatory.co.uk/astro/spectroscopy_21.htm
Cheers
Robin
22 June 2020 at 7:18 pm #582673SpectatorThanks Robin for the good info on creating a comparison quality assessment. I will use this as a framework to build my capability to the level needed. I found that I had several issues with the initial setup of Demetra, and a misunderstanding on how to use the reference stars to create a response curve.
Among the learning curve issues that I have resolved or managed to understand
– I had incorrectly set the zones in the target images for the spectrum response (too wide of a strip), and the background noise (too small of a region of the image). Once I reset those, my SNR improved significantly and the results improved.
– Calibration – still having problems in getting Demetra to ‘automatically’ recognize the calibration image and to properly assign the right spectral line. When I use ‘automatic’ I cannot get better than 2.4 RMS, where if I go in an manually set the lines to the image (5852, 6562, 6965, 7067, 7383) my calibration gets a very good .2-.8 RMS. The software may not be at fault. I develop platforms, and told one user ‘it’s idiot proof’… he confidently told me ‘you dont have the right idiots’…..
– Response: I was mistaken on how to use /implement the response curve. I thought I was to take an image of a ‘reference star’ after imaging each ‘target star’. Then use that image to create a response curve. I thought I was supposed to use the MILES (or Pickles) db to create a ‘response curve’ from the image of the ‘Reference Star’ by smoothing it from the MILES/Pickles db. Then apply that curve to the image of my ‘Target star’. I could not figure out how to apply that response curve to the ‘Target star’ in Demetra. However after some great info from the team here on BAA, I have been using just the B/A type reference star (derived from the spreadsheet) to create that smoothed ‘response curve’ directly from the MILES db onto my ‘Target star’.
Although I am not to the high quality results I am wanting yet, I am consistently starting to see results close to those on the BAA site.
Still learning a lot, and not quite to the levels to make any good sense from a test as you propose, as I want my results on a singular basis to be angstrom level accurate before I move to the next step (some targets <.5a others >2a depending on where in the spectrum)… So working on this repeatability now.
Always appreciative of any new suggestions, will keep pushing on this path.
Thanks
Keith
23 June 2020 at 11:49 am #582676Robin LeadbeaterParticipant– Calibration – still having problems in getting Demetra to ‘automatically’ recognize the calibration image and to properly assign the right spectral line. When I use ‘automatic’ I cannot get better than 2.4 RMS, where if I go in an manually set the lines to the image (5852, 6562, 6965, 7067, 7383) my calibration gets a very good .2-.8 RMS.
Yes these automatic systems tend to either work or fail catastrophically. (I often tell the tale from my other life in paper technology where we had developed a sensor which used a neural network to measure a property using the NIR spectrum. It was trained on a range of products and worked flawlessly….. until one day it started producing compete nonsense. It turned out the manufacturer of one of the materials used in the paper had made a subtle change in the formulation which he had not told us about !)
I can’t help with Demetra, though at Francois Cochard’s zoom workshop meeting on calibration, I did promise to try it!
https://www.youtube.com/watch?v=vijEMrow0hQ
(ISIS has an automatic function which works flawlessly for me with my ALPY and LHIRES, though unlke Demetra it does need some manual input to tune it initially and you need to point it to the approximate position of one line, then it can find them all)
Cheers
Robin
23 June 2020 at 2:20 pm #582677Robin LeadbeaterParticipantHi Keith,
I don’t know what version of Demetra you have but I see Shelyak have just (19th June) brought out a version specifically including support for the LISA
https://www.shelyak.com/logiciel-demetra/?lang=en
https://www.shelyak.com/wp-content/uploads/20200619-ChangeLog.pdf
Robin
24 June 2020 at 7:46 pm #582682SpectatorRobin thanks for the information and especially the great news for the update of Demetra for the LISA! I do not have this version, and am very happy to see it available! I had watched the replay of the Shelyak session thanks for the link and it is seen that there are still some items to work through on the sw. I will try out this new version and come back.
David gave me some great info on limiting the spectral lines used as a base to use for the LISA calibration on Demetra (previous version) and that worked very well getting me an RMS .173 which is quite acceptable. I have tried this on several images with similar results but now, with the new version of Demetra I will see what happens.
Thanks will hope to test tonight, we have been getting summer monsoons here the last week, but it looks like that is over now and we can get back to our more normal dry & hot….
Thanks for the help, much appreciated!
Keith
-
AuthorPosts
- You must be logged in to reply to this topic.