VLF Project
Solar X-rays
![]() Geomagnetic Field
Geomagnetic Field
![]()
Interpreting SID’s & Data Submission
The shape of recorded flares will vary from one observer to another, but a little experience while the sun is active will allow most events to be isolated from other interference. The text-book SID has a sharp rise to a definite peak, followed by a longer recovery period. In practise, many SID’s do not look that simple, and may have multiple peaks. SID’s may also appear inverted. This variation in shape is due to a combination of the path from transmitter to receiver and the varying state of the ionosphere. The sun often produces multiple flares over a short period, leading to superimposed SID’s that can create confusion.
The following illustrations show some typical events:
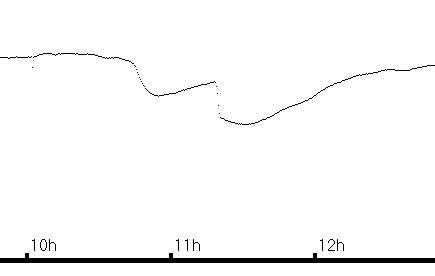
This is typical of an ordinary SID that I record. Measurement is fairly easy. It is inverted relative to ‘normal’, but is clearly the correct shape.
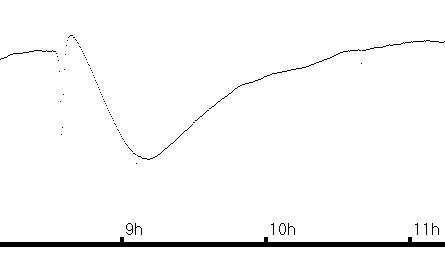
This is typical of a much more energetic solar flare, producing a SID that has a double peaked structure. The start and end times can be measured as usual; the peak time I measure at the maximum point, in this case at 08:37UT.
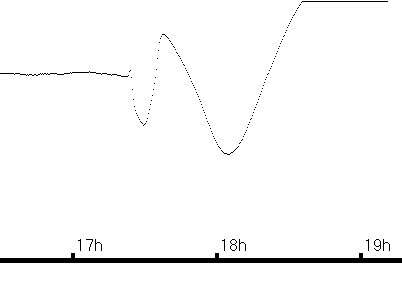
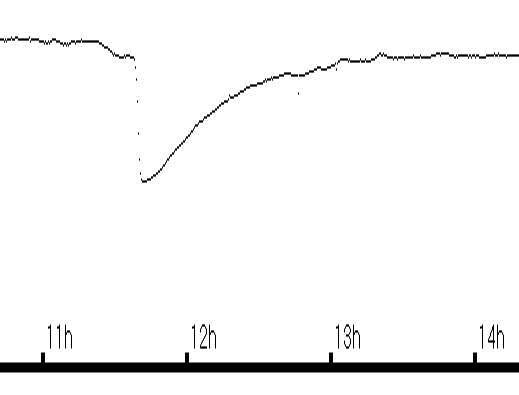
This is much more difficult, as the flare occurred during the sunset dip in signal strength. The result is a combination of the two effects. The start is easily measured, and the peak is also clear (as above). The end time cannot be measured, and would be left blank.
This recording shows 2 flares in rapid succession, such that the SID’s overlap. An end time for the first event cannot be measured.
These sudden ionospheric disturbances might be recorded thus:
| Date | Start | Peak | End | Importance |
| 2005 March 10 | 11:39UT | 11:42UT | 12:42UT | 2+ |
| 2005 September 15 | 08:33UT | 08:37UT | 10:33UT | 3 |
| 2005 September 7 | 17:23UT | 17:28UT | ? | – |
| 2005 September 13 | 10:45UT | 10:55UT | ? | – |
| 2005 September 13 | 11:18UT | 11:32UT | 12:05UT | 2+ |
Note that all times are recorded in Universal Time (=GMT).
If you would like to contribute observations to this programme, please send them to John Cook, Observations should be in the format described above and submitted on a monthly basis, with a deadline of the 15th of the succeeding month.
John Cook
Papers
Mark Edwards has produced a paper on Modelling SIDs. His model results map will with observed results and the paper is available from Modelling SIDs
Richard Knott has produced a paper “Report on logging SID data from an UKRAA VLF receiver using an AB electronics UK ADC Pi and a Raspberry Pi 4 Model B 2GB connected to UKRAA VLF aerial, VLF aerial tuning unit and VLF receiver” The paper is here
| The British Astronomical Association supports amateur astronomers around the UK and the rest of the world. Find out more about the BAA or join us. |