› Forums › Spectroscopy › T Tau – P Cyg profiles?
- This topic has 9 replies, 4 voices, and was last updated 5 years, 4 months ago by
 Kevin Gurney.
-
AuthorPosts
-
6 December 2018 at 12:11 am #574198
 Kevin GurneyParticipant
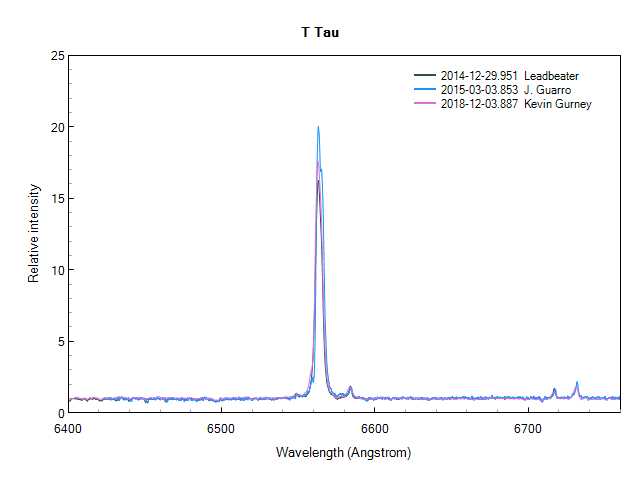
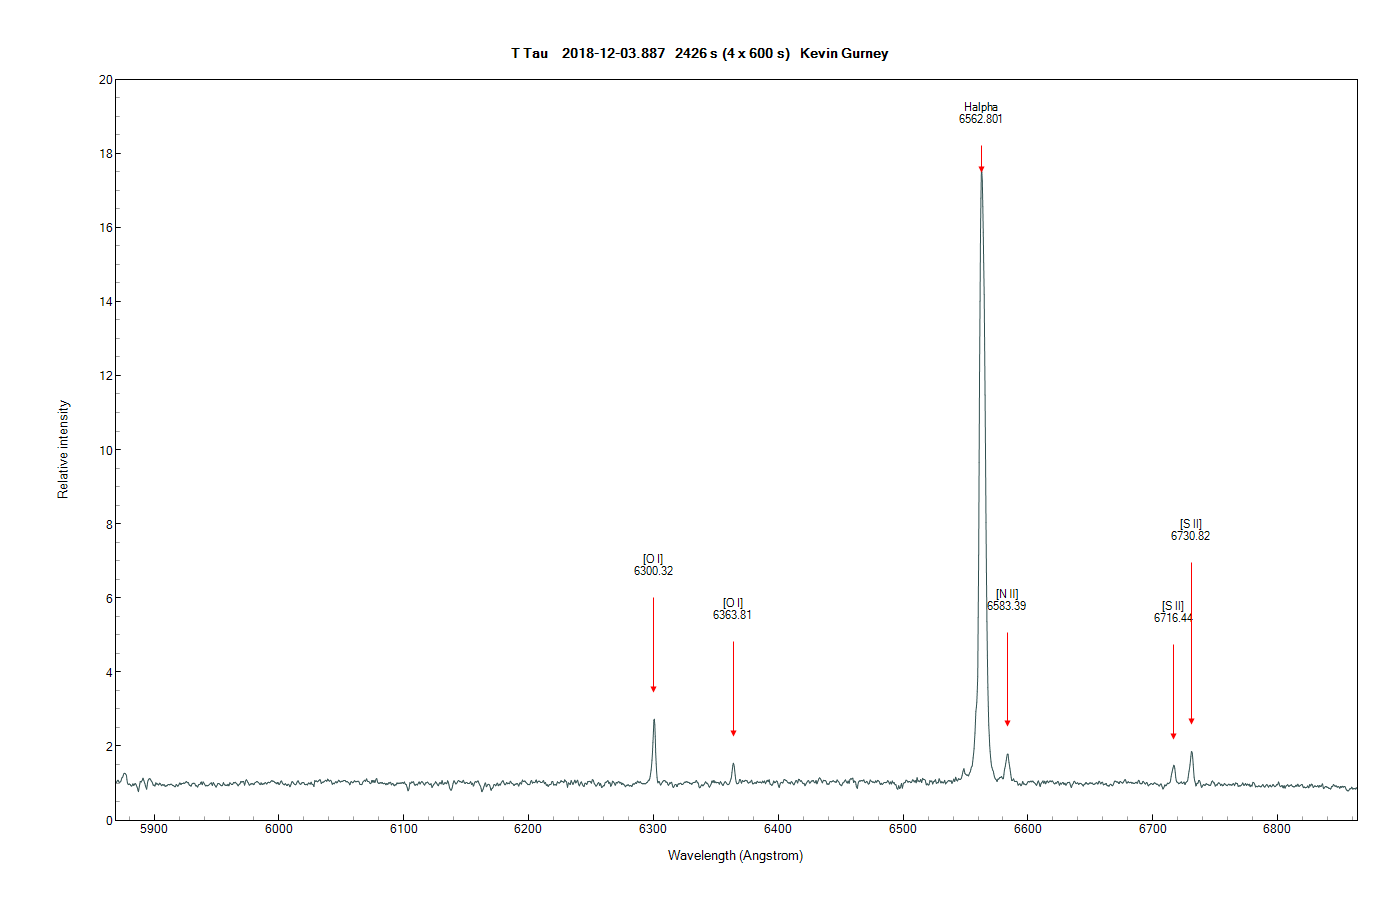
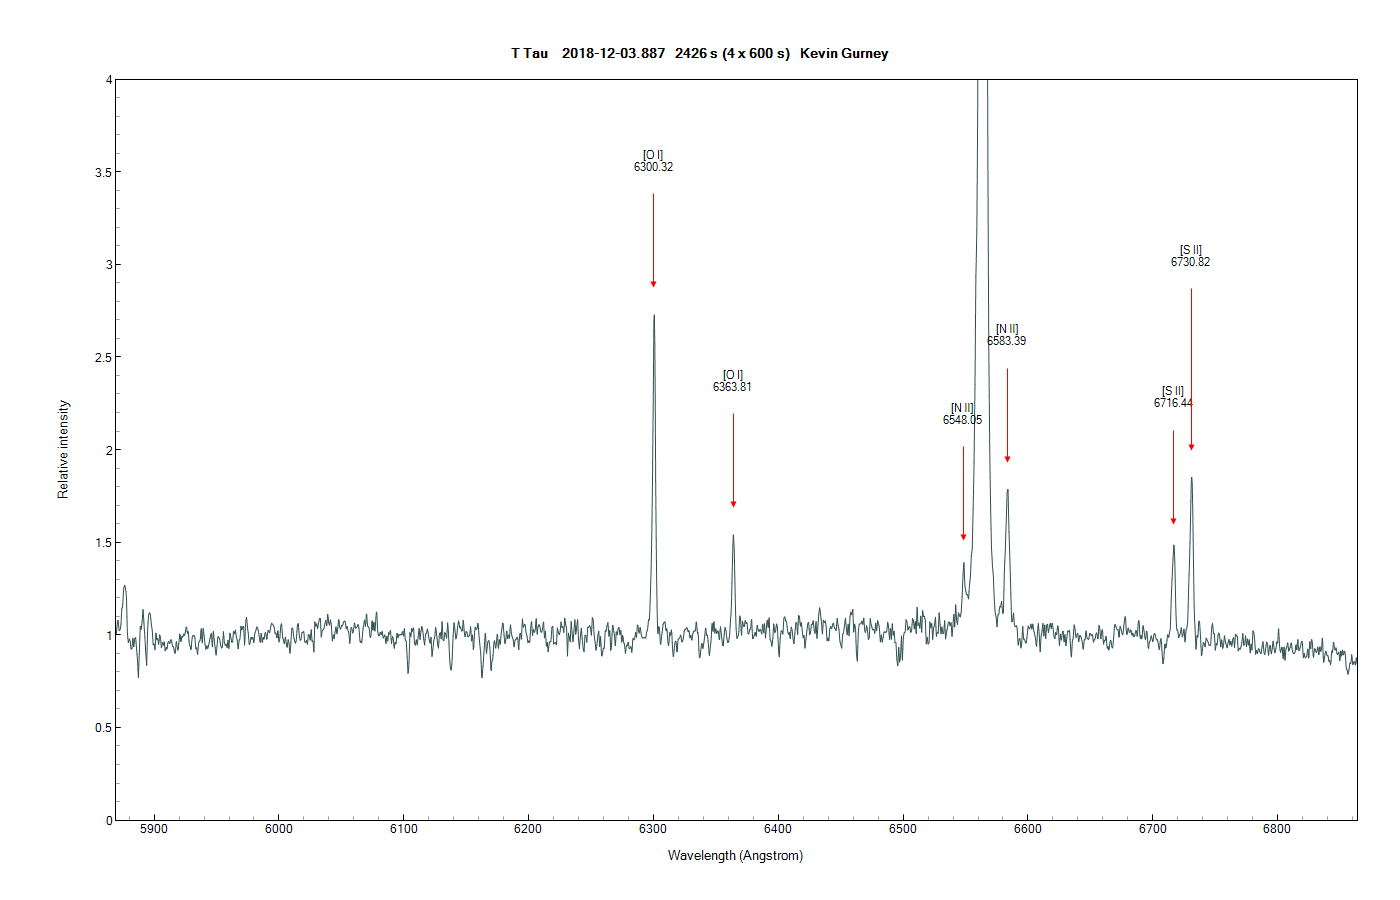
I captured T Tau at medium Res on the 3rd… (Lhires with 600 l/mm grating). See attached (full range, and close up around Ha)
I see that, in Richard Walkers Atlas (Plate 41) he notes (Inverse) P Cygni profiles for the OI and SII lines. In my spectrum, this feature is conspicuous by its absence (in my view anyway). Is there a dynamic to these in T Tau that might cause these features to come and go?
Kevin
Attachments:
6 December 2018 at 9:41 am #580329 David BoydParticipant
T Tauri stars are young dynamic objects experiencing accretion from a circumstellar disc. This is a stochastic process so changes over time are normal. An inverse P-Cygni profile is a signature of infalling material which is part of the accretion process. However accretion is not continuous and tends to happen irregularly so it is not really surprising if the inverse P-Cygni profiles come and go in the spectrum. It would be interesting to take further spectra periodically to see how they change. Changes in accretion may also manifest themselves as changes in the magnitude of the star as it brightens and then fades.
David
6 December 2018 at 2:16 pm #580330 Robin LeadbeaterParticipant
Hi Kevin
There is a series of around 35 spectra of the H alpha region from me and Joan Guarro Flo covering December 2014- March 2015 in the database. (I think taken as part of a Pro-Am project but I forget exactly what, I will look it up) How does yours compare ?
Robin
EDIT they were taken as part of this project (I actually made a note on the spectra in the database, seen if you tick to see all fields)
requested by Hans Moritz Guenther http://www.spectro-aras.com/forum/viewtopic.php?f=5&t=1033
6 December 2018 at 2:40 pm #580331Kevin GurneyParticipantDavid – thanks for the astrophysics backdrop. It does look like one might see interesting variation…
Robin – following the direct link you gave (forum topic), I can see comparable spectra from Paulo Berardi and Tim Lester… similar features to mine (reassuring I guess…).
But on the ARAS databse…
http://www.astrosurf.com/aras/Aras_DataBase/DataBase.htm
…the link for T Tauri is greyed out, and the direct link from the home page goes to a broken link..?
Guenther was also behind the recent appeal for HAeBe spectra related to a Chandra campaign. (I took V1410 Ori and sent on…). I suppose the T tau and HAeBe are similar objects so that makes sense. (Guenther looks very young on his web site, but maybe thats also the contrast effect with me getting older 🙂
Kevin
6 December 2018 at 2:47 pm #580332Robin LeadbeaterParticipantSome of the emission also comes from a nebula surrounding T Tauri see my spectrum image here for example
http://www.spectro-aras.com/forum/viewtopic.php?f=5&t=1033&start=10#p4659
so perhaps what you see in these forbidden lines depends on how tightly you set the binning and sky background regions and how the slit is orientated
Robin
6 December 2018 at 3:08 pm #580333Robin LeadbeaterParticipant“But on the ARAS databse…..the link for T Tauri is greyed out, and the direct link from the home page goes to a broken link..?”
Yes I noticed that. I have put a note on the thread asking it to be fixed. A timely reminder to everyone to mirror their results in a reliable long term database like the BAA one ! (mine and GJF are in there)
Cheers
Robin
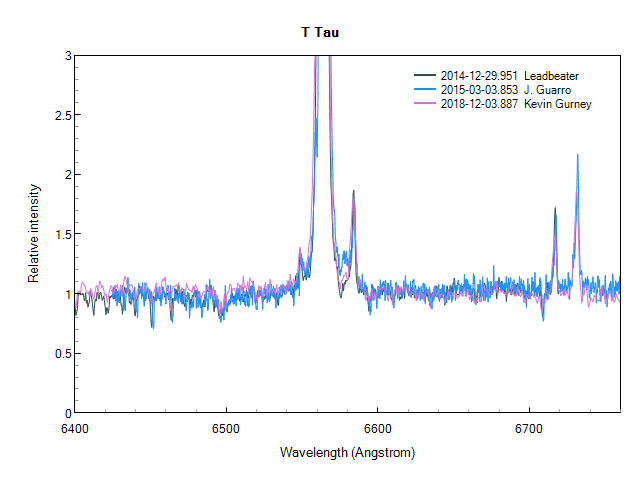
6 December 2018 at 3:24 pm #580334Robin LeadbeaterParticipantHere are some comparisons from the BAA database. (quick and dirty, no helio or telluric or continuum corrections)
 6 December 2018 at 4:16 pm #580335Kevin GurneyParticipant
Hi Robin
Yes – I saw a vertical extension beyond the normal line spectrum too… and was wondering about nebulosity. I think R Mon maybe even ‘worse’ in this respect as it is associated with NGC 2261 (Hubbles variable neb.)? I havent taken this one yet.
My binning could have been slightly tighter (but not much). And if the nebulosity is part of the system, then its fair game perhaps..
Kevin
6 December 2018 at 5:14 pm #580336 Forrest SimsParticipant
Hi,
Kevin, you mentioned R Mon.
I just uploaded my LISA spectrum from 2018-12-04.306 for R Mon to the BAA spectroscopy database. OI and SII emission lines as well as FeII emission lines are quite prominent. The OI lines appear to display a P Cygni profile. Not enough resolution for me to tell on the SII lines.
Woody Sims
14 December 2018 at 5:35 pm #580398Kevin GurneyParticipantHi there
I can see O1 at 6364 might have P-cygnus-like status – Is that what you mean?
Kevin
-
AuthorPosts
- You must be logged in to reply to this topic.