› Forums › Spectroscopy › What wavelength error is acceptable with an Alpy?
- This topic has 52 replies, 5 voices, and was last updated 7 years, 4 months ago by
 Robin Leadbeater.
-
AuthorPosts
-
29 October 2018 at 3:17 pm #574158
 John CoffinParticipant
I have been working hard to calibrate my spectra collected by my Alpy. I have spent a lot of time trying to get the spectrum horizontal and have also adjusted the grism.
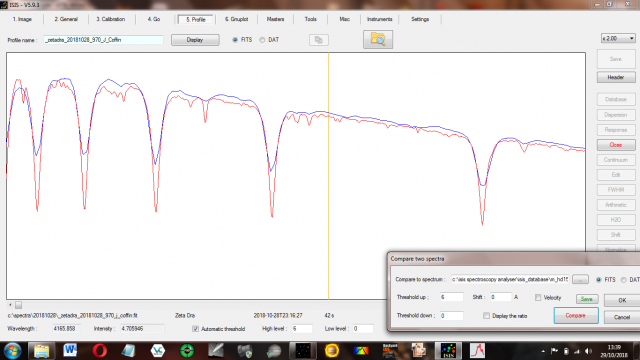
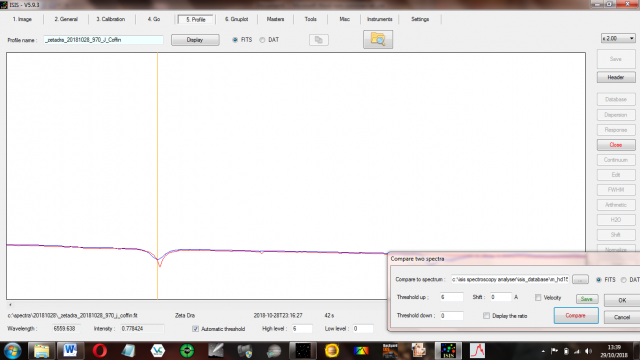
I have found the absorption lines of my spectrum of zeta draconis matched those in the Miles database from H beta to H epsilon, but H alpha was blue shifted by about 3 Angstroms.
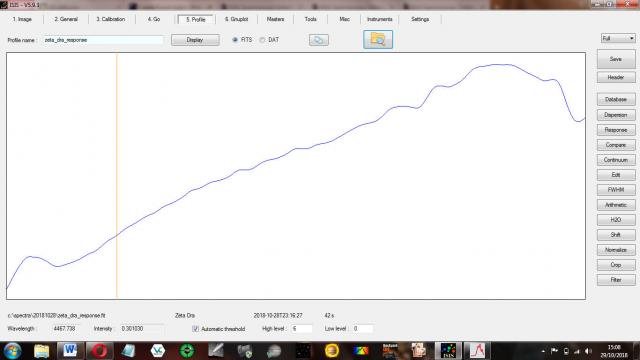
It was a moonlit night with intermittent cloud and zeta draconis was at a lowish altitude of 36 deg, so could that explain why my instrumental response curve had a hump around 3940?
I am using ISIS with an Alpy calibration lamp. The lamp images were not saturated and I used the mean of 13 images to make a “master” calibration image.
I used the “Alpy with calibration module” option in “settings” and the predefined dispersion option on the general tab. I used the calibration assistant in the calibration tab, and ticked the UV calibration box.
My spectrum was tilted by 0.28 degrees. The calibration lines are not vertical despite adjusting the grism.
Here is the neon image.
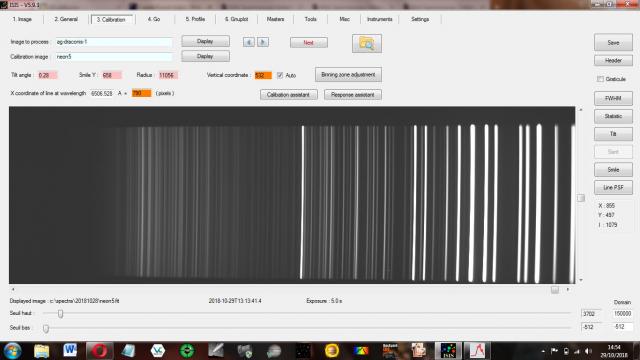
The tilt increases towards the right.
Do I need to adjust the grism again, a very difficult process to get right, or is this kind of error at the red end of the spectrum normal for an Alpy?
29 October 2018 at 3:41 pm #580122 Robin LeadbeaterParticipant
Hi John,
I am not sure the wavelength calibration of the MILES stars is all that accurate. I remember seeing some apparent discrepancies when I was trying to do some radial velocity work. Do your individual errors for the lamp lines look good particularly those bracketing the H alpha line? (from the report that ISIS generates in the “Go” window. )
I would not worry about adjusting the Grism further if ISIS is finding the lines to do the wavelength calibration OK (The RMS error should be low, <0.5A and there should be no obvious larger errors in any individual line as reported by ISIS)
The kink in the instrument response of the ALPY around 4000A is real and often seen, though the cause is not clear. See my recent post here for example.
https://britastro.org/comment/5542#comment-5542
Cheers
Robin
29 October 2018 at 3:59 pm #580123Robin LeadbeaterParticipantOK I have checked the MILES zet Dra spectrum and the Balmer lines do appear to be at the expected wavelengths ( eg 4861, 6563A) There will be small adjustments to make for the radial velocity and heliocentric correction but these will not add up to as much as 3A so there looks to be something going on here. Can you post a copy of what ISIS reports in the “Go” window please?
Thanks
Robin
29 October 2018 at 4:31 pm #580124John CoffinParticipantHere is the text of the ISIS report after pressing the Go button on the calibration assistant.
Extract spectral profile…
Input image : c:spectra20181028mean.fit
Y-coordinate of binning zone : 532
Binning zone width : 27
Sauve the rectified image : c:spectra20181028@.fit
Save the profile : c:spectra20181028@.dat (uncalibrated spectra)
Ok.
——————————————
Extract spectral profile…
Input image : c:spectra20181028neon5.fit
Y-coordinate of binning zone : 532
Binning zone width : 27
Sauve the rectified image : c:spectra20181028@@.fit
Save the profile : c:spectra20181028@@@@.dat (uncalibrated spectra)
Ok.
————————————————————————–
Lines search zone
| -5 | 373 | 3 |
| -5 | 384 | 3 |
| -5 | 401 | 3 |
| -4 | 428 | 4 |
| -5 | 478 | 3 |
| -3 | 584 | 5 |
| -5 | 790 | 7 |
| -5 | 809 | 7 |
| -6 | 878 | 6 |
| -5 | 929 | 7 |
| -6 | 1070 | 6 |
| -8 | 1124 | 6 |
| -10 | 1202 | 4 |
Gaussian fit on : +/-5 pixels
————————————————————————–
Reciprocical inverse dispersion equation
Coefficient a4 : 2.039047E-10
Coefficient a3 : -1.032328E-06
Coefficient a2 : 1.289598E-03
Coefficient a1 : 4.25183
Coefficient a0 : 2113.351
————————————————————————–
Fitting deviation (wavelength)
point #1 x = 373.309 lambda = 3835.394 dlambda = -0.004
point #2 x = 384.441 lambda = 3889.156 dlambda = -0.106
point #3 x = 401.092 lambda = 3969.698 dlambda = 0.382
point #4 x = 428.333 lambda = 4101.743 dlambda = 0.007
point #5 x = 477.589 lambda = 4341.144 dlambda = -0.664
point #6 x = 584.329 lambda = 4860.809 dlambda = 0.531
point #7 x = 790.079 lambda = 5852.713 dlambda = -0.223
point #8 x = 809.454 lambda = 5944.744 dlambda = 0.086
point #9 x = 877.733 lambda = 6266.474 dlambda = 0.016
point #10 x = 929.332 lambda = 6506.631 dlambda = -0.101
point #11 x = 1070.153 lambda = 7147.050 dlambda = -0.010
point #12 x = 1123.593 lambda = 7383.774 dlambda = 0.176
point #13 x = 1201.871 lambda = 7723.850 dlambda = -0.090
————————————————————————–
RMS : 0.351305 (in angstroms)
————————————————————————–
Ok.
Here is the report from the Go page.
Load the image : c:spectra20181028zeta_draconis-1.fit
Load the image : c:spectra20181028zeta_draconis-2.fit
Load the image : c:spectra20181028zeta_draconis-3.fit
Load the image : c:spectra20181028zeta_draconis-4.fit
Load the image : c:spectra20181028zeta_draconis-5.fit
Load the image : c:spectra20181028zeta_draconis-6.fit
Substract the offset : c:spectra20181028caliboffset.fit
Substract the dark : c:spectra20181028calibdark600_b2_minus10-.fit
Dark coefficient (1) : 0.0333
Dark coefficient (2) : 0.0333
Dark coefficient (3) : 0.0333
Dark coefficient (4) : 0.0333
Dark coefficient (5) : 0.0333
Dark coefficient (6) : 0.0333
Divide by the flat-field : c:spectra20181028flat.fit
Flat-field level : 38002
Cosmetic correction : c:spectra20181028calibcosme.lst
Smile correction – Y0 = 658 Radius = 11056
Transverse registration at intermediate Y coordinate = 532.00
Spectrum Y coordinate Y 1 = 533.31
Spectrum Y coordinate Y 2 = 533.47
Spectrum Y coordinate Y 3 = 533.53
Spectrum Y coordinate Y 4 = 533.73
Spectrum Y coordinate Y 5 = 533.76
Spectrum Y coordinate Y 6 = 533.58
Remove sky background
Save image : c:spectra20181028@s.fit (sky not removed)
Save 0b product : c:spectra20181028_Zeta Dra.fit (2D image)
Adopted Y coordinate : 531.51
Tilt correction (second pass)
Remove sky background (second pass)
Write 2D image : c:spectra20181028@1.fit
Write 2D image : c:spectra20181028@2.fit
Write 2D image : c:spectra20181028@3.fit
Write 2D image : c:spectra20181028@4.fit
Write 2D image : c:spectra20181028@5.fit
Write 2D image : c:spectra20181028@6.fit
Optimal binning
Write raw profile : c:spectra20181028@raw1.dat
Write raw profile : c:spectra20181028@raw2.dat
Write raw profile : c:spectra20181028@raw3.dat
Write raw profile : c:spectra20181028@raw4.dat
Write raw profile : c:spectra20181028@raw5.dat
Write raw profile : c:spectra20181028@raw6.dat
Intensity of individual profiles (ADU)…
Mean (median) for profile #1 : 277922 (48733)
Mean (median) for profile #2 : 267284 (46730)
Mean (median) for profile #3 : 274253 (46119)
Mean (median) for profile #4 : 283042 (47260)
Mean (median) for profile #5 : 261331 (48022)
Mean (median) for profile #6 : 247607 (44406)
Standard summation of individual profiles
Save uncalibrated spectral profile : c:spectra20181028@star.dat
Processing of calibration image : c:spectra20181028neon5.fit
Dark coefficient (calibration) : 0.0083
Save image : c:spectra20181028@calib.fit (2D image)
Save spectral profile : c:spectra20181028@calib.dat
Spectral calibration
Computed A0 parameter : 2113.160 (actual polynom A0 = 2113.351)
Predefined dispersion polynom :
Coefficient a4 : 2.039047E-10
Coefficient a3 : -1.032328E-06
Coefficient a2 : 1.289598E-03
Coefficient a1 : 4.25183
Coefficient a0 : 2113.351
—————————————————————————-
Normalization spectral range : [6650 – 6750]
Normalization value (final profile) : 42238320.9
Normalization value (individulal profile #1) : 7339427.7
Normalization value (individulal profile #2) : 7005366.1
Normalization value (individulal profile #3) : 7012000.4
Normalization value (individulal profile #4) : 7058567.1
Normalization value (individulal profile #5) : 7157459.9
Normalization value (individulal profile #6) : 6665499.8
—————————————————————————-
Spectrum #1 ( b ) – ( v ) intensity = ( 0.839 ) – ( 0.996 )
Spectrum #2 ( b ) – ( v ) intensity = ( 0.862 ) – ( 0.994 )
Spectrum #3 ( b ) – ( v ) intensity = ( 0.913 ) – ( 0.997 )
Spectrum #4 ( b ) – ( v ) intensity = ( 0.951 ) – ( 0.998 )
Spectrum #5 ( b ) – ( v ) intensity = ( 0.786 ) – ( 0.996 )
Spectrum #6 ( b ) – ( v ) intensity = ( 0.798 ) – ( 0.997 )
( b ) – ( v ) mean intensity = ( 0.858 ) – ( 0.996 )
( b ) – ( v ) median intensity = ( 0.862 ) – ( 0.997 )
—————————————————————————-
Write individual DAT processed profile : c:spectra20181028@pro1.dat
Write individual DAT processed profile : c:spectra20181028@pro2.dat
Write individual DAT processed profile : c:spectra20181028@pro3.dat
Write individual DAT processed profile : c:spectra20181028@pro4.dat
Write individual DAT processed profile : c:spectra20181028@pro5.dat
Write individual DAT processed profile : c:spectra20181028@pro6.dat
Write individual FITS processed profile : c:spectra20181028@pro1.fit
Write individual FITS processed profile : c:spectra20181028@pro2.fit
Write individual FITS processed profile : c:spectra20181028@pro3.fit
Write individual FITS processed profile : c:spectra20181028@pro4.fit
Write individual FITS processed profile : c:spectra20181028@pro5.fit
Write individual FITS processed profile : c:spectra20181028@pro6.fit
—————————————————————————-
Write final profile : c:spectra20181028_zetadra_20181028_970_J_Coffin.fit
Write final profile : c:spectra20181028_zetadra_20181028_970_J_Coffin.dat
Intermediate files removed
—————————————————————————-
Acquisition starting date : 28/10/2018 23:16:27
Duration : 42.0 secondes
Mid-exposure date : 28.970/10/2018
Mid-exposure Julian day : 2458420.4700
Resolution power : 521.5
Ok.
29 October 2018 at 5:23 pm #580125Robin LeadbeaterParticipantOK John,
ISIS seems to have found the lines ok and the fit looks good. I am wondering if there has been some sort of shift between the lamp spectrum and the star spectrum. With the mixed Balmer and lamp line calibration you are using, the lines used for calibration up to 4861 (H Beta) are the Balmer lines in the star and the lines higher than that are from the calibration lamp. Normally the ALPY is very stable but if everything is not quite tightened up, there could have been a shift between the star and lamp exposures. Did you take the lamp spectrum under the same conditions as the star ?
Can you also run the calibration using just the lamp lines ? If there was a shift, we should then see all the Balmer lines shifted, not just H alpha
Cheers
Robin
29 October 2018 at 6:15 pm #580126John CoffinParticipantDear Robin, all the Balmer lines were blue shifted by about 2 A, though H zeta and H epsilon were shifted by 3 and 2.5 A respectively.
I’ll check all the connectors, though I thought they were tight really.
Here’s the report
Load the image : c:spectra20181028zeta_draconis-1.fit
Load the image : c:spectra20181028zeta_draconis-2.fit
Load the image : c:spectra20181028zeta_draconis-3.fit
Load the image : c:spectra20181028zeta_draconis-4.fit
Load the image : c:spectra20181028zeta_draconis-5.fit
Load the image : c:spectra20181028zeta_draconis-6.fit
Substract the offset : c:spectra20181028caliboffset.fit
Substract the dark : c:spectra20181028calibdark600_b2_minus10-.fit
Dark coefficient (1) : 0.0333
Dark coefficient (2) : 0.0333
Dark coefficient (3) : 0.0333
Dark coefficient (4) : 0.0333
Dark coefficient (5) : 0.0333
Dark coefficient (6) : 0.0333
Divide by the flat-field : c:spectra20181028flat.fit
Flat-field level : 38096
Cosmetic correction : c:spectra20181028calibcosme.lst
Smile correction – Y0 = 658 Radius = 11056
Transverse registration at intermediate Y coordinate = 533.00
Spectrum Y coordinate Y 1 = 533.31
Spectrum Y coordinate Y 2 = 533.47
Spectrum Y coordinate Y 3 = 533.53
Spectrum Y coordinate Y 4 = 533.73
Spectrum Y coordinate Y 5 = 533.76
Spectrum Y coordinate Y 6 = 533.58
Remove sky background
Save image : c:spectra20181028@s.fit (sky not removed)
Save 0b product : c:spectra20181028_Zeta Dra.fit (2D image)
Adopted Y coordinate : 532.51
Tilt correction (second pass)
Remove sky background (second pass)
Write 2D image : c:spectra20181028@1.fit
Write 2D image : c:spectra20181028@2.fit
Write 2D image : c:spectra20181028@3.fit
Write 2D image : c:spectra20181028@4.fit
Write 2D image : c:spectra20181028@5.fit
Write 2D image : c:spectra20181028@6.fit
Optimal binning
Write raw profile : c:spectra20181028@raw1.dat
Write raw profile : c:spectra20181028@raw2.dat
Write raw profile : c:spectra20181028@raw3.dat
Write raw profile : c:spectra20181028@raw4.dat
Write raw profile : c:spectra20181028@raw5.dat
Write raw profile : c:spectra20181028@raw6.dat
Intensity of individual profiles (ADU)…
Mean (median) for profile #1 : 278613 (48845)
Mean (median) for profile #2 : 267945 (46851)
Mean (median) for profile #3 : 274931 (46238)
Mean (median) for profile #4 : 283742 (47380)
Mean (median) for profile #5 : 261979 (48189)
Mean (median) for profile #6 : 248222 (44512)
Standard summation of individual profiles
Save uncalibrated spectral profile : c:spectra20181028@star.dat
Processing of calibration image : c:spectra20181028neon5.fit
Dark coefficient (calibration) : 0.0083
Save image : c:spectra20181028@calib.fit (2D image)
Save spectral profile : c:spectra20181028@calib.dat
Spectral calibration
————————————————————————–
Primary dispersion :
Coefficient a4 : -1.941613E-13
Coefficient a3 : 5.199794E-09
Coefficient a2 : -4.783460E-05
Coefficient a1 : 0.39175
Coefficient a0 : -710.014
————————————————————————–
RMS : 0.091500 (en pixels)
————————————————————————–
Primary wavelength fit deviation
point #1 Lambda = 3770.630 px = 326.562 dx = -0.067
point #2 Lambda = 3797.300 px = 332.190 dx = 0.154
point #3 Lambda = 3835.390 px = 340.215 dx = -0.078
point #4 Lambda = 3889.050 px = 351.495 dx = -0.013
point #5 Lambda = 3970.080 px = 368.476 dx = 0.043
point #6 Lambda = 4101.750 px = 395.954 dx = -0.049
point #7 Lambda = 4340.480 px = 445.487 dx = -0.017
point #8 Lambda = 4861.340 px = 552.926 dx = 0.039
point #9 Lambda = 6562.850 px = 910.356 dx = -0.070
point #10 Lambda = 6869.000 px = 976.968 dx = 0.067
point #11 Lambda = 7605.000 px = 1140.339 dx = -0.009
————————————————————————–
Inverse dispersion equation
Coefficient a4 : 2.999117E-10
Coefficient a3 : -1.336891E-06
Coefficient a2 : 1.632851E-03
Coefficient a1 : 4.09469
Coefficient a0 : 2135.790
————————————————————————–
RMS : 0.311249 (in angstroms)
————————————————————————–
Wavelength fit deviation
point #1 x = 397.713 lambda = 3945.982 dlambda = 0.118
point #2 x = 441.652 lambda = 4158.959 dlambda = -0.369
point #3 x = 513.877 lambda = 4510.640 dlambda = 0.090
point #4 x = 520.824 lambda = 4544.520 dlambda = 0.530
point #5 x = 544.099 lambda = 4658.045 dlambda = -0.145
point #6 x = 565.974 lambda = 4764.726 dlambda = 0.144
point #7 x = 607.204 lambda = 4965.603 dlambda = -0.523
point #8 x = 696.858 lambda = 5400.458 dlambda = 0.102
point #9 x = 791.067 lambda = 5852.415 dlambda = 0.075
point #10 x = 878.731 lambda = 6266.457 dlambda = 0.033
point #11 x = 930.316 lambda = 6506.578 dlambda = -0.048
point #12 x = 1071.150 lambda = 7147.069 dlambda = -0.029
point #13 x = 1124.583 lambda = 7383.958 dlambda = 0.022
————————————————————————–
Coefficient a4 : 2.999117E-10
Coefficient a3 : -1.336891E-06
Coefficient a2 : 1.632851E-03
Coefficient a1 : 4.09469
Coefficient a0 : 2135.790
————————————————————————–
RMS : 0.311249
————————————————————————–
—————————————————————————-
Normalization spectral range : [6650 – 6750]
Normalization value (final profile) : 42355639.7
Normalization value (individulal profile #1) : 7359979.4
Normalization value (individulal profile #2) : 7024372.2
Normalization value (individulal profile #3) : 7031455.9
Normalization value (individulal profile #4) : 7078341.5
Normalization value (individulal profile #5) : 7177964.8
Normalization value (individulal profile #6) : 6683525.9
—————————————————————————-
Spectrum #1 ( b ) – ( v ) intensity = ( 0.836 ) – ( 0.996 )
Spectrum #2 ( b ) – ( v ) intensity = ( 0.860 ) – ( 0.994 )
Spectrum #3 ( b ) – ( v ) intensity = ( 0.910 ) – ( 0.997 )
Spectrum #4 ( b ) – ( v ) intensity = ( 0.948 ) – ( 0.998 )
Spectrum #5 ( b ) – ( v ) intensity = ( 0.784 ) – ( 0.996 )
Spectrum #6 ( b ) – ( v ) intensity = ( 0.796 ) – ( 0.997 )
( b ) – ( v ) mean intensity = ( 0.856 ) – ( 0.996 )
( b ) – ( v ) median intensity = ( 0.860 ) – ( 0.997 )
—————————————————————————-
Write individual DAT processed profile : c:spectra20181028@pro1.dat
Write individual DAT processed profile : c:spectra20181028@pro2.dat
Write individual DAT processed profile : c:spectra20181028@pro3.dat
Write individual DAT processed profile : c:spectra20181028@pro4.dat
Write individual DAT processed profile : c:spectra20181028@pro5.dat
Write individual DAT processed profile : c:spectra20181028@pro6.dat
Write individual FITS processed profile : c:spectra20181028@pro1.fit
Write individual FITS processed profile : c:spectra20181028@pro2.fit
Write individual FITS processed profile : c:spectra20181028@pro3.fit
Write individual FITS processed profile : c:spectra20181028@pro4.fit
Write individual FITS processed profile : c:spectra20181028@pro5.fit
Write individual FITS processed profile : c:spectra20181028@pro6.fit
—————————————————————————-
Write final profile : c:spectra20181028_zetadra_20181028_970_J_Coffin.fit
Write final profile : c:spectra20181028_zetadra_20181028_970_J_Coffin.dat
Intermediate files removed
—————————————————————————-
Acquisition starting date : 28/10/2018 23:16:27
Duration : 42.0 secondes
Mid-exposure date : 28.970/10/2018
Mid-exposure Julian day : 2458420.4700
Resolution power : 507.6
Ok.
29 October 2018 at 6:23 pm #580127John CoffinParticipantI took these lamp lines indoors. The one I took last night was saturated towards the red end of the spectrum and gave me a similar result and were taken at the end of the evening after the calibration star. The ambient temperature was 2 C last night. Next time I will take some in the middle of the target exposures, and again with the reference star and see if that makes any difference.
29 October 2018 at 8:01 pm #580131Robin LeadbeaterParticipantOK, I think the constant shift with just the lamp confirms that there was some shift in the spectrograph (It is very small. I think 3A equates to about 5um or about a pixel). The changing temperature might have been a factor. With the ALPY I usually take a lamp spectrum each time I change target during an observing run even though I normally dont see any shift during the night. (With the LHIRES I see a lot of movement so I take a lamp spectrum at start and end on every target and every half hour or so during long exposures but it is much less stable thermally and mechanically than the ALPY)
Cheers
Robin
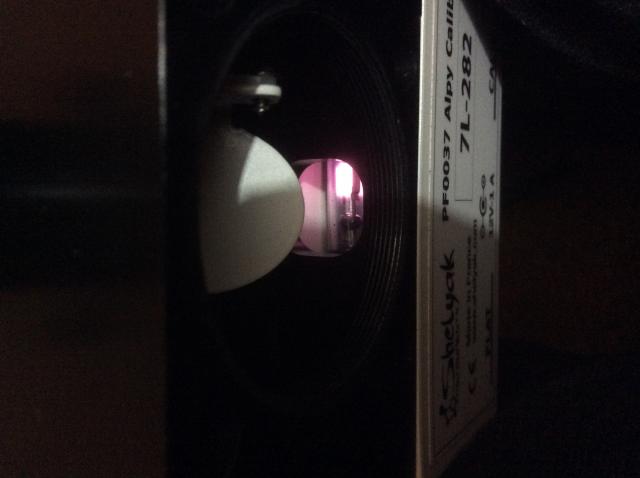
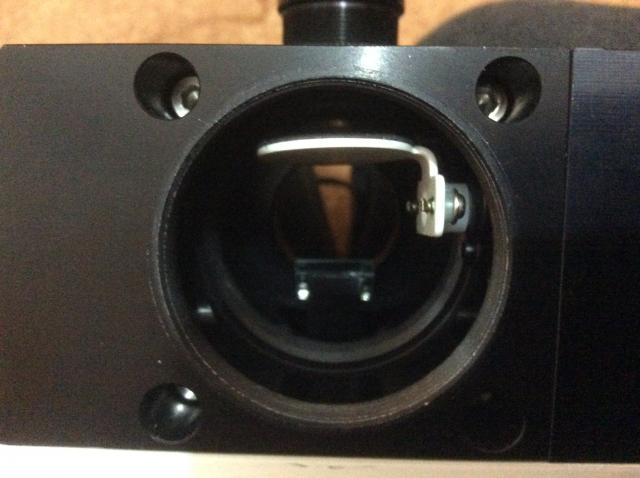
29 October 2018 at 8:13 pm #580132Robin LeadbeaterParticipantOne other thing that could be worth checking is that the servo controlled reflector is set so the calibration lamp is shining directly down on the slit. If the slit is illuminated at a significant angle, it can cause small shifts relative to the star spectrum. (I’ve not heard of this with the ALPY but I suspected this problem with the original manual LHIRES system)
Cheers
Robin
29 October 2018 at 11:39 pm #580135John CoffinParticipantThe reflector isn’t perfectly straight and the bulb emits light from one side of itself.
 30 October 2018 at 10:37 am #580136Robin LeadbeaterParticipant
Ok the reflector position looks ok. ( I was concerned that the reflector might not be rotating to the correct position. It can be adjusted by operating the switches in a particular sequence) Not sure what any offset in the lamp might do (The asymmetry in the lamp internally is normal) and I cant see mine at the moment as it is mounted on the scope but is probably best not to change anything until you have checked the calibration with lamp spectra taken at the same time as the star spectrum.
I have been having a look at some of my past calibrations and I am also seeing wavelength errors between lamp and star (I use just the lamp without the star Balmer lines) In my case H alpha is spot on but there is an increasing error towards the blue to around 2-3A by 3900A where the lamp lines end, so errors of this order might be typical. What are other other ALPY users seeing?
We might be seeing a fundamental limitation in the calibration accuracy using the internal lamp. At this level (~1/4 the slit width) effects such as the position of the star on the slit and subtle differences in line shape due to optical aberrations come into play.
Cheers
Robin
30 October 2018 at 10:49 am #580137 Dr Andrew SmithParticipant
It did occurs to me that with a non-linear dispersion you might get errors due to more lines being fitted at the red end compared to the blue. This would then give a better fit in the red while a poorer one in the blue even if the overall fit looked good.
Regards Andrew
30 October 2018 at 4:13 pm #580143Dr Andrew SmithParticipantI had a play with Excel and fitted the data to different orders all were good fits but you can see the difference in the extrapolation into the blue. Order 1 fitted at R=0.9998 ,orders 2,3,4 fitted to R=1 the graphs are order 1,3,4. The blue line is the fitted data and red the extrapolation using the ISIS fit.
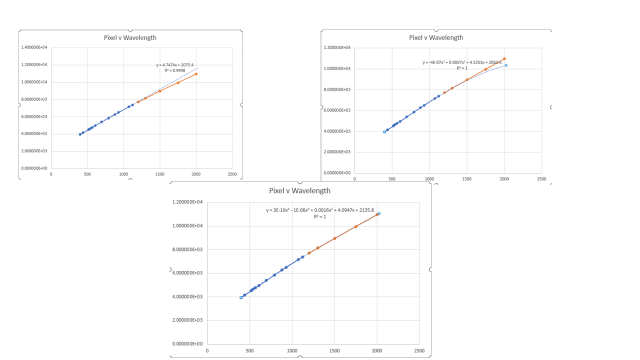
Regards Andrew
30 October 2018 at 10:27 pm #580145Robin LeadbeaterParticipantHi Andrew,
The extrapolation is into the red not the blue ?
Do you have the residuals for the blue points for the different fits? Particularly how much improvement in the fit is there going from 3 to 4 ?
Robin
30 October 2018 at 10:37 pm #580146Dr Andrew SmithParticipantHi Robin, no I just used the trend function in Excel which just reports the R value. I will see if I can just fit it in Excel proper rather than on the graph.
I nitially I was refering to wavelength then I was referring to the colour on the plots not wavelength. I should have changed the colour to avoid the confusion. Just used the defaults without thinking.
Regards Andrew
31 October 2018 at 9:57 am #580147 David BoydParticipant
I am curious about the wavelengths which both John (implicitly in the ISIS listings) and Robin give for their calibration lamps. These are different from the standard Ar and Ne wavelengths given by NIST, for example here https://physics.nist.gov/PhysRefData/ASD/lines_form.html
If you look at the discrepancies which ISIS lists in John’s calibration fit, these appear to be almost exactly what is needed to bring the lines into agreement with the NIST values.
I have the Shelyak Ar-Ne lamp in my LISA and use a .lst file in ISIS which contains the NIST wavelength values. This routinely gives me a 4th order polynomial fit with rms residual less than 0.1.
David
31 October 2018 at 11:51 am #580149Robin LeadbeaterParticipantHi David,
Ah sorry, I see the wavelengths I posted (and listed by ISIS in the reports) are the values calculated from the fit, not the true values.
There does not seem to be a problem with the quality of the fit to the lines, at least within the range of lines used. (RMS ~0.2-0.3A seems typical for the ALPY.) The issue is apparent systematic differences in wavelength up to 3A between the lamp and the star)
Cheers
Robin
31 October 2018 at 12:03 pm #580150Dr Andrew SmithParticipantHi Robin the 3rd order fit has 0.57 and the fourth 0.34. The fourth is as the ISIS fit. Though looking at this again I don’t think this is an issue.
DAVID makes an interesting point about the line wavelengths though.
Regards Andrew
I will need to do this again as I used Robin’s figures!
31 October 2018 at 12:20 pm #580151Dr Andrew SmithParticipantThe error is about 1/2 a pixel. I wonder if it is due to undersampling in which case it will be a practical limit unless you use smaller pixels.
Somewhere I have a paper on this and I will try to find it.
Regards Andrew
31 October 2018 at 12:29 pm #580152John CoffinParticipantLast night’s specrum of Pi Andromeda (HD 00369) was still about 3 A out at H alpha but very accurate from H beta to epsilon.
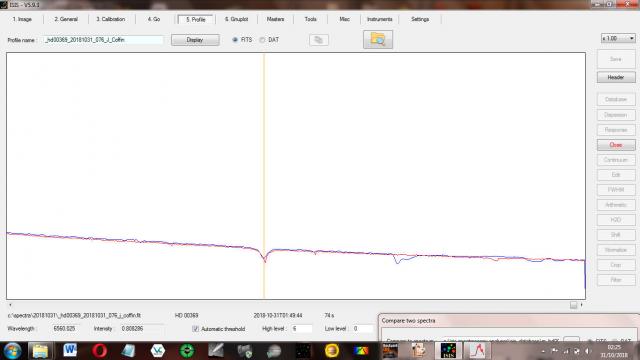
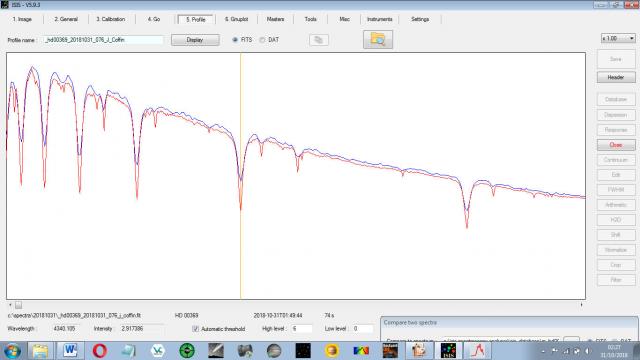
If this is an error due to undersampling why would it only affect H alpha?
If undersampling is the issue, can I calibrate the dispersion of a spectrum collected binned x 2 using a reference star that was not binned?
-
AuthorPosts
- You must be logged in to reply to this topic.