› Forums › Spectroscopy › Request for monitoring of X Per
- This topic has 30 replies, 6 voices, and was last updated 6 years ago by
 Hugh Allen.
-
AuthorPosts
-
19 September 2018 at 3:34 pm #574131
 Robin LeadbeaterParticipant
Some more information on the request for spectra of X Per from Dr Paul Roche, CardiffUniversity, announced here
https://britastro.org/node/15515
X Per is an X-ray binary where material from a Be star disc accretes onto a companion neutron star. It is Vmag 6.7 so bright enough for high resolution spectra.
It is not in BeSS currently as it is not considered a “classical” Be star system but if anyone currently monitoring Be stars could add it to their list he would be grateful. He is looking initially for high resolution H alpha spectra to monitor the state of the disc. Spectra can be added to the BAA database and any changes in disc state seen should be announced here or direct to Paul or me. More information from him below
Cheers
RobinHe writes:-
I’d like to (re)start a monitoring programme on the Be star X Persei, the optical counterpart to the X-ray pulsar system 4U0352+309. This is an unusual X-ray system, with a slow pulsar (~14 mins spin period) in a wide binary (~250 day) orbit, which exhibits phases where the Be star loses it’s circumstellar disc (characterised by unusally faint periods where the primary fades to V~6.9-7.0). X Per is generally a bright B0e star (V~6.4-6.7), and I’m interested in setting up a long term monitoring project to try and follow the system through it’s next disc-loss phase.
I did this in the 1990s (as part of my PhD) and it was very successful, and with the growth of amateur spectroscopy I’m keen to see if we can keep tabs on the behaviour of the H alpha line as well as on the photometric behaviour, as this line is a strong indicator of the state of the circumstellar disc that gives the Be star it’s “e”.
In BeXRB systems (and X Per in particular) the H alpha emission and IR excess are exactly as would be expected from a standard Be star, and the neutron star accretes from passage through the outer regions of the disc (leading to transient emission), so a system like X Per can be considered and monitored in exactly the same way as a single Be star. Changes in the disc have an impact on the X-ray behaviour of the system, as the neutron star is influenced by changes in the size and density of the disc (which is where it occasionally accretes, once the disc reaches the distances of the neutron star orbit). So monitoring the disc emission provides a clue as to the future behaviour of the X- ray source, and I’m hoping that a monitoring programme can help predict X-ray emission when we start to see signs of disc growth and then loss.
Ideally I’m looking for as much UBVRI photometry as possible over the next few years, with any H alpha spectroscopy an added bonus. The system has long period variability, but short period (minutes) changes in both photometry and spectroscopy have been noted previously. I’m going to be setting up a monitoring programme using the Faulkes Telescope Project (via the Las Cumbres Observatory facilities, mainly the 0.4m ‘scopes in the network as this is a bit bright for a 2m!), but having additional data would be fantastic and would be really valuable in helping to monitor the overall system on timescales of weeks-months-years, and correlate with X-ray behaviour in particular.
H alpha line profile and the overall spectral shape, and/or just the EW of H alpha, would be useful – H alpha (as high res as possible) is really what I’m after at this point as it’s usually the best indicator of disc behaviour, but any data that can be gathered would be great. I’m hoping to get a Masters student to look into all of this over the next year, and then each year after that, as it seems to be an unusual system even amongst the Be stars, and also amongst the BE/X-ray systems!
Dr. Paul Roche
Cardiff University
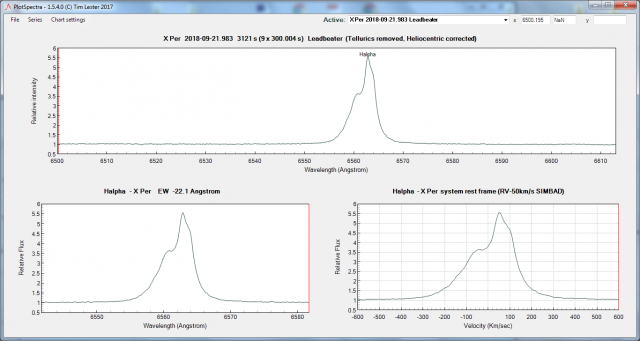
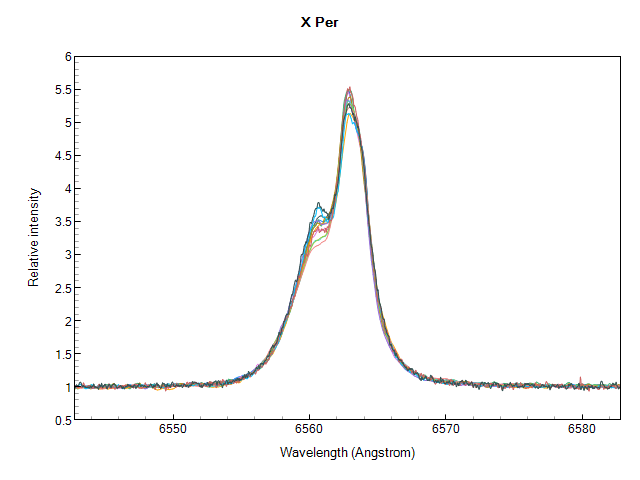
Faulkes Telescope Project22 September 2018 at 5:58 pm #580019Robin LeadbeaterParticipantHere is how the H alpha line looks currently. (LHIRES 2400 grating, R~15000). Also uploaded to the BAA spectroscopic database
Robin
 29 September 2018 at 2:53 pm #580034Robin LeadbeaterParticipant
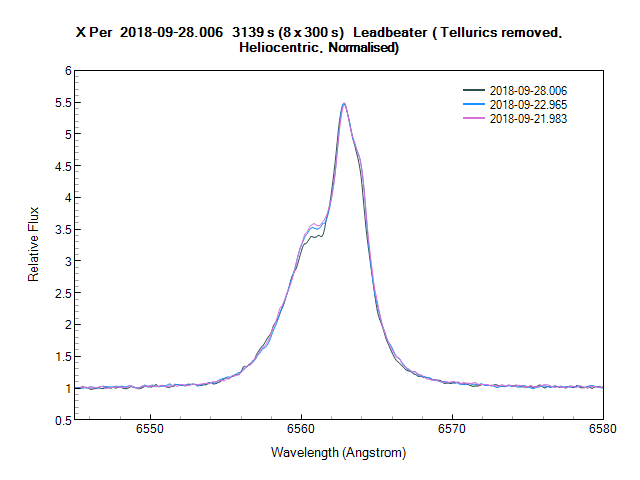
Changes in H alpha over past 6 days
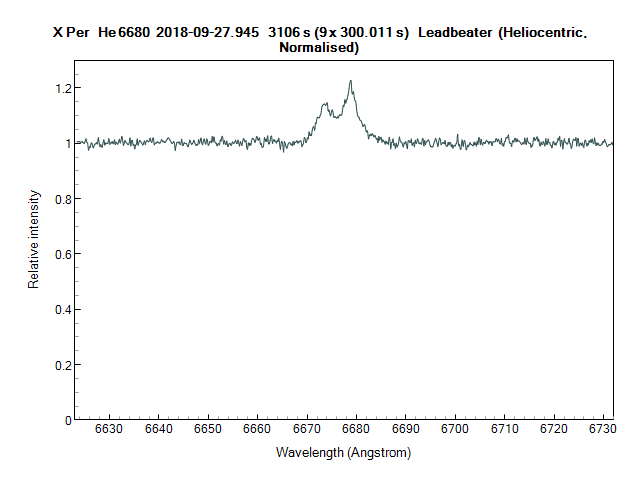
The He I 6680 line (approximately 15x weaker than H alpha)
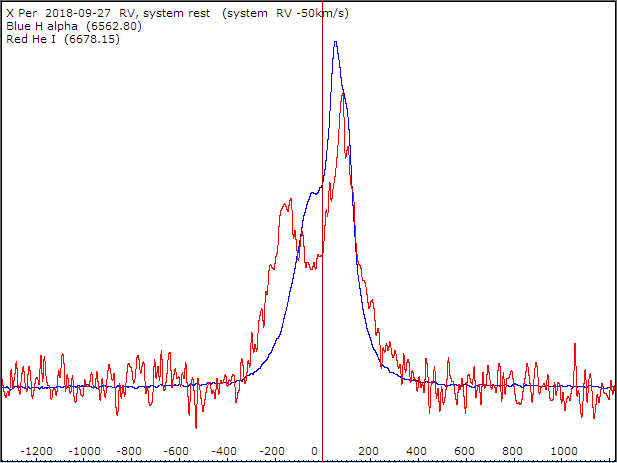
Radial Velocity of both lines (km/s, plotted in system rest frame)
Cheers
Robin
2 October 2018 at 6:25 pm #580039 Kevin GurneyParticipant
 Hi Robin
Attached is my X Per (Lhires Ha) from two nights ago… Its in the database
2 October 2018 at 6:35 pm #580040Kevin GurneyParticipantI also sent on to Paul Roche – hope that’s OK.
Kevin
2 October 2018 at 11:12 pm #580042Robin LeadbeaterParticipantYes, that’s great.
Thanks !
24 October 2018 at 8:50 pm #580084 Hugh AllenParticipant
Hi Robin,
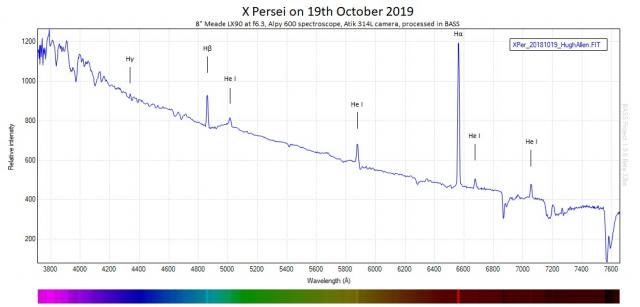
Here’s my recent Alpy spectrum of X Persei. I realise that the main interest is in higher resolution spectra centred on the Hα emission, but even at low resolution X Persei gives a beautiful spectrum peppered with interesting emission lines. I’ll aim to keep my eye on this star
Cheers
Hugh
 25 October 2018 at 12:05 pm #580085Robin LeadbeaterParticipant
Thanks Hugh,
I think monitoring with low resolution spectra will be useful to detect any significant changes in the strength of the emission lines and when combined with the photometry, will give an absolute measure of the flux which is difficult to do at high resolution.
(The kink in the continuum around H beta is curious. Is the instrument response is ok in that region ?)
Cheers
Robin
26 October 2018 at 11:32 am #580091Kevin GurneyParticipantI now have four observations and thought I detected some regular, cyclic activity. I made a gif in ISIS to try and draw this out..
https://giphy.com/gifs/astronomy-spectroscopy-be-stars-jTd7ZILZzsqrcNecVn
(just right click, save and view locally – the website is a huge distraction!)
Paul has the data…
Kevin
26 October 2018 at 2:28 pm #580092Robin LeadbeaterParticipantHi Kevin,
You could well be right. I was looking at the variability the other day, using some from the BAA database and some I had been sent direct.
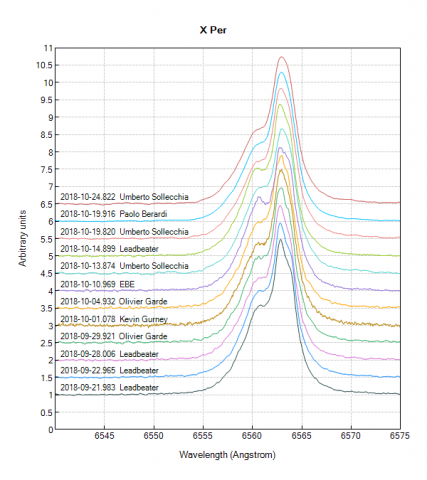
The spectra are good quality and there is good coverage so it might be possible to characterise the variability. There is some sign of rapid variations, even from day to day though so any period might be rather short. It might be worthwhile doing a run over a full night and looking at the short term variability.
Robin
26 October 2018 at 2:34 pm #580093Robin LeadbeaterParticipantSimilar variability is also seen in the He 6680A line.
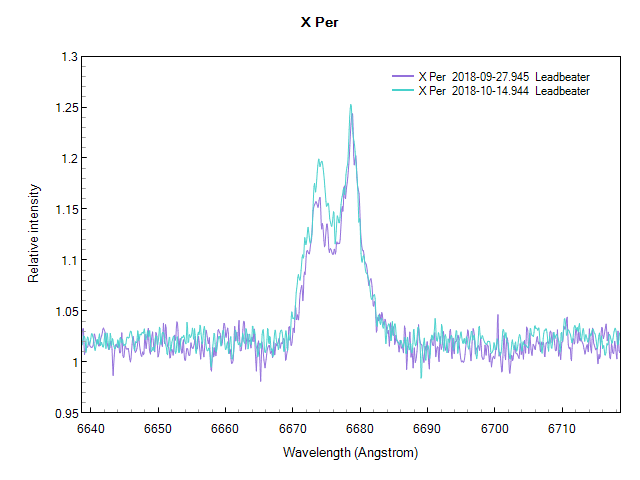
Although the line is much weaker, the variability is actually greater as a percentage compared with at H alpha
Robin
26 October 2018 at 2:46 pm #580094Robin LeadbeaterParticipantA reminder that spectra to BeSS standard normally do not have telluric lines removed or heliocentric corrections applied so it is important to make these corrections before comparing them. (I remember seeing a poster by a professional which claimed to show features moving in a line profile which were in fact due to telluric lines in heliocentric corrected spectra !)
Robin
27 October 2018 at 10:52 am #580096Hugh AllenParticipant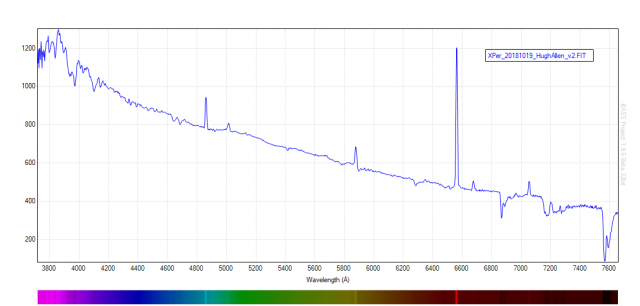
Hi again Robin,
Thanks for querying the response correction. There was indeed a very shallow dip in my response correction curve around 5000Å. So I revisited my response correction by applying the continuum response shaper in BASS from a more ‘distant’ perspective. I would normally smooth the response correction curve by zooming in on 2 sections, from 3600-5500Å and then continuing on to 5500-7700Å. In this second attempt I smoothed the curve in one view from 3600-7700Å. The shallow dip around 5000Å was much less visible in this revisited curve, although there is still an ‘undulation’ in the resulting X Per response corrected spectrum, so it would be interesting to compare with another low res spectrum on the BAA database if one appears. I always review the response corrected reference star spectrum against the library reference for obvious discrepancies but I should have questioned more the bump around the HeI emission. I have replaced my spectrum in the database with this newer v2.
Response correction of low res spectra can be a bit of an art form, especially at the near UV end where it can be like grasping the tail of a thrashing snake!
Thanks as ever for your guidance
Cheers
Hugh
27 October 2018 at 4:07 pm #580099Robin LeadbeaterParticipantHi Hugh,
Yes the acid test is to rerun the reference star using the calculated instrument response
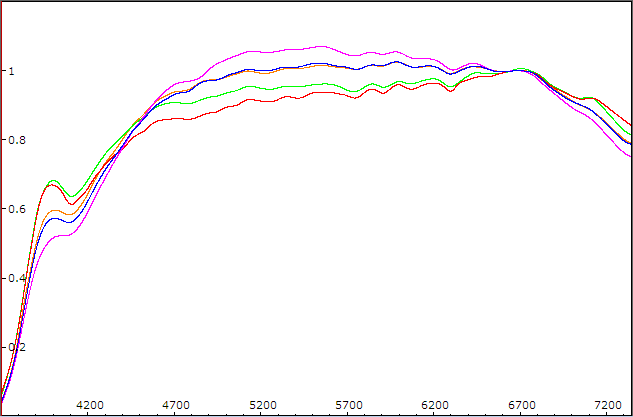
If the flat has done its job well the instrument response should be nice and smooth (just the flat lamp spectrum and atmospheric extinction plus any wavelength selective sampling at the slit due to chromatism) I am not sure if BASS does this but ISIS even assumes a black body curve for the flat lamp so in theory with ISIS ideally all you should be left with is the atmospheric extinction. With my LHIRES at H alpha high resolution this results in a dead flat instrument response within a couple of percent every time so it is hardly worthwhile doing an instrument response correction. In practise with my ALPY there are some small ripples at a couple of percent from the sensor response which the flat has not quite dealt with and a rather nasty kink to deal with around 4000A. I am not sure where it comes from but others have also reported it. Perhaps the reflectivity of the paint used on the reflector used in the ALPY calibration module ? Note the variation in shape in this collection of my IR curves. A lot of this I believe is due to chromatic aberration in my focal reducer coupled with slight differences in focus.
 1 November 2018 at 7:21 pm #580171
 Tony RoddaParticipant
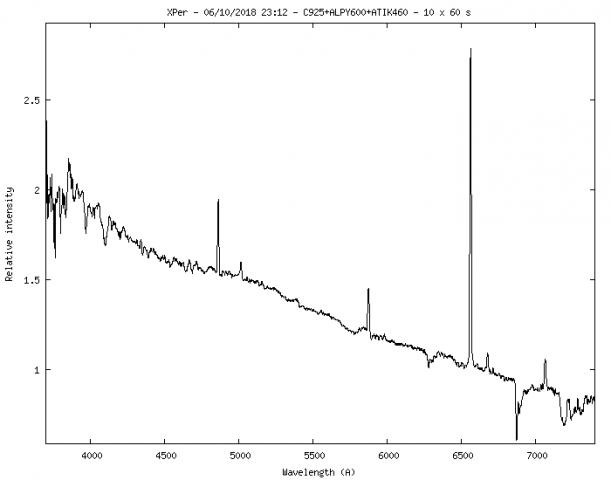
Taken a few weeks ago.
Rgds T
 23 November 2018 at 1:31 am #580273
 John CoffinParticipant
Here is one from the 18th November with an Alpy.
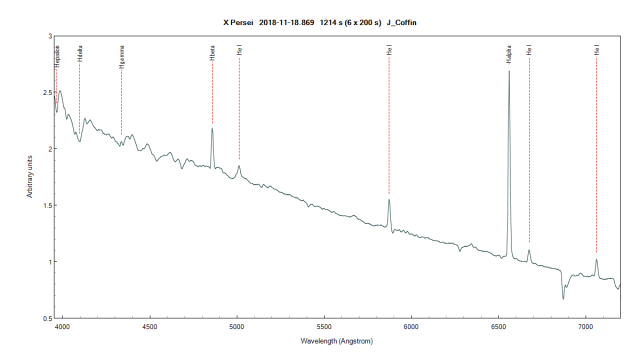
What changes are we looking for, and how often should we monitor with low resolution spectra?
23 November 2018 at 12:47 pm #580275Robin LeadbeaterParticipantAs I understand it from Paul Roche’s comments this is a long term project (with a timescale of years), primarily to alert when there has been a change in the disc state, indicated by changes in the H alpha line so similar to typical Be star monitoring. Though this would likely change if something significant is seen. High resolution H alpha spectra will probably show more subtle changes first but a low resolution spectrum would also pick up significant changes in emission line strength so I would suggest an occasional look say once every few weeks or so, particularly if you see in the BAA database (where most of the campaign spectra are being stored) that there has been a significant gap since the last observation.
Cheers
Robin
24 November 2018 at 10:31 am #580277Robin LeadbeaterParticipantThis paper shows examples of the long term variation (1987-2001) at H alpha and He 6678 including an episode where the disc was completely lost in 1988 and cyclic changes with periods 0.6-2 yrs
https://www.aanda.org/articles/aa/abs/2001/47/aa1796/aa1796.html
The variability that Kevin highlighted (and confirmed in the other spectra) shows small scale variations in the line profiles at much shorter timescales though
Robin
24 November 2018 at 11:19 am #580278Hugh AllenParticipant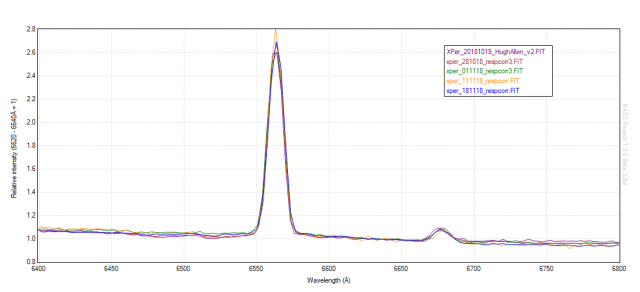 I now have about a month’s baseline spectra for monitoring the extent of more significant changes in the coming years…24 November 2018 at 11:40 am #580279Robin LeadbeaterParticipant
Here is the trend in H alpha line strength (EW) since the disc loss episode in 1988 to ~2015, from fig 1 in this paper
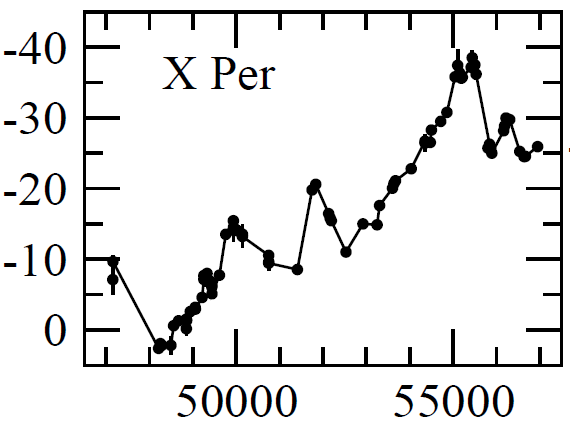
The EW currently is ~20 A so a continuing downward trend currently
-
AuthorPosts
- You must be logged in to reply to this topic.