Jupiter
in 2014/15: Interim report
(2015 Feb.8)
John
Rogers (British Astronomical Association),
with
data from the JUPOS team (Gianluigi Adamoli, Michel Jacquesson, Marco Vedovato,
Hans-Joerg Mettig, Grischa Hahn)
Summary of major features: Click image below for larger version.
S1
domain (S.Temperate region) [see Fig.7, JUPOS chart]:
The
pattern has not changed much since last apparition. There are still two
structured sectors: one comprising the STB Ghost (a faint bluish cyclonic
streak: Fig.3), the other comprising Oval BA and the single STB dark segment
f. it. Oval BA has some red colour
though weaker than last apparition. It passed the GRS last autumn, and since
it did so, much dark material has accumulated chaotically in the STropZ
between BA and the GRS, while very dark streaks have looped around the GRS and
a prominent S.Tropical Band has formed.
The
STBn jet outbreak p. oval BA is now intermittent, presumably ending.
A major volley of dark spots in it appeared in Oct., but they faded as
they prograded, and mostly expired as they approached the STB Ghost.
S.
Tropical domain:
The
Great Red Spot is at L2 = 223, increasing at +1.4 deg/month. It is still small
and red, but has been surrounded by complex dark streaks this apparition.
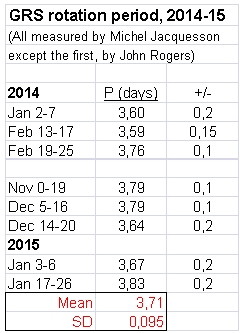
The best images (e.g. Fig.4) often detect small grey streaks within it
and these have enabled Michel Jacquesson to make more measurements of its
internal circulation period, following up our previous reports.
The observed period has been 3.6 to 3.8 days throughout, as shown in
the Table below.
The
SEB is normal, with the usual conspicuous rifted region f. the GRS. The light
patch that was prominent in recent years p. the GRS has become very elongated
and ill-defined.
N.
Tropical domain:
The
NEB shows the usual dark formations on its S edge and rifted regions within
it. The N edge is ragged with few stable features.
The most conspicuous is ‘white’ spot Z, which again deserves this
name as it has lost almost all of the reddish tint that it acquired last
apparition.
N1
domain (N.Temperate region):
This
domain continues to evolve in a complex manner in the aftermath of the
upheaval in
2012. There are several dark
streaks of NTB(N), within a long N. Temperate Disturbance (NTD), whose ends
have shifted over a matter of months.
Details
of some less prominent but interesting features:
S3
& S4 domains [see Fig.5, JUPOS chart]:
There
are AWOs in each domain as usual, although their identifications with earlier
years are unclear, as there were 2 or 3 in each domain in 2012/13, and drift
rates have varied. I presume the
large, reddish one at ~60 S, which prograded rapidly until 2014 Dec. then
suddenly halted at L2 ~ 30, is the long-lived one (S4-AWO-1).
A smaller AWO at ~60 S (labelled S4-AWO-2) likewise prograded until
~2014 Nov.1 then halted at L2 ~160. Remarkably, the one prominent AWO at ~50 S
(labelled S3-AWO-1) has been just Np. S4-AWO-2 for over a year, with a
parallel, typically oscillating track that halted at the same time, at L2 ~
140. There is no visible connection between these two ovals, but in 2005 and
2006, we likewise found that a S4-AWO tended to stay close to a S3-AWO [report
in preparation].
There
is a short sector of retrograding dark spots in the S3 domain, probably at ~49
S and persisting from 2013-2015 with speed close to the S3TC or System III,
even though S3-AWO-1 crossed this sector -- just as we reported for 2005-2010.
The images do not show an obvious source for these spots.
There
is also an unusual rapidly prograding dark spot in the S3 domain, which had
DL2 = -32 deg/month (Nov-Dec) then turned reddish with DL2 = -37 (Dec-Jan),
crossing north of S3-AWO-1. It
seems to be a cyclonic barge. Given
its reddening, I expect it is now fading away.
S2
domain [see Fig.6, JUPOS chart]:
There are now 11 AWOs in the S.S. Temperate domain! Two new ones are labelled A7a and A7b (A7a and A7ab on Marco’s latest maps). A7a and A8 passed oval BA in 2014 Dec.
In
2013/14, two reddish cyclonic ovals were recorded between pairs of AWOs [see
our 2013/14 report no.8], and not surprisingly, both of these became cyclonic
white ovals. They can be seen in Fig.2, labelled CWO, although both are now
small.
S1
jet (STBn jetstream) [see Fig.9]:
The
STBn jet outbreak p. oval BA is now intermittent, presumably ending.
A major volley of dark spots in it appeared in Oct., comprising a long
dark sector of STB(N). They accelerated from DL2 ~ -80 to ~-100, but they
faded as they prograded, and mostly expired as they approached the STB Ghost.
One exception was a well-defined spot in the middle of the volley, which did
pass the STB Ghost (shifting north and decelerating from -105 to -92 as it did
so), and continued to the f. edge of the GRS, where it drifted north and
disappeared [Fig.9]. (We likewise
found that STBn jet spots decelerated as they passed the STB Ghost in 2013/14
and the STB Remnant in 2005 [unpublished report, 2014 July 8].)
Another volley, on a smaller scale, is visible in the attached
images from late Dec.
N1
domain (N.Temperate region) [see Fig.8 (JUPOS chart) & Figs.10 & 11
(Maps)]:
This
domain continues to evolve in a complex manner in the aftermath of the
upheaval in
2012. The development of the domain up to 2014 Feb. was described in our
2013-14 Report no.6 (see Figs.12 & 13: labelled maps and JUPOS chart;
those figures are here updated to 2015 Jan.). There
are several dark streaks of NTB(N), within a long N. Temperate Disturbance (NTD),
whose ends have shifted over a matter of months.
All these features are moving with the NTC at DL2 ~+14 deg/month.
There
is one exceptionally dark streak or barge, lying at ~30 deg.N and thus
cyclonic (L2 ~ 150 in 2014 Oct., 195 in 2015 Jan.).
It probably developed from the new centre of activity in the domain
which appeared in 2014 Feb. This
centre of activity consisted of mini-rifting in the NTB which soon generated
an extremely dark spot in the NTZ (anticyclonic); during April this lengthened
to become a long dark streak or chain in NTZ.
I think that this was incorporated into the long NTD during solar
conjunction, and the dark brown barge (cyclonic) was a new feature developed
at or near the original site of rifting. It has marked the p. end of the NTD.
Another
dark barge, red-brown in colour, was noted by Michel Jacquesson in 2014 Oct.
at L2 ~ 290, ~30 deg.N, embedded in a very dark sector of NTD.
It has expanded into a longer streak, still red-brown, while material
around it has faded somewhat. This
is just one of several dark streaks of NTB(N) within the NTD which have become
increasingly distinct from Oct. to Jan.
The
NTD was ~150 deg. long in 2014 Sep., but increasing dark material in the NTZ
further f. extended it to a maximum length of ~240 deg. in Nov.
Since then, the p. and f. parts of the NTD have been partially
clearing. We have shown previously
that a NTD is generated by a mini-rifted region in the NTB, which is
consistent with the latest developments: maps
in Dec. showed no mini-rifted region near the very dark barge at the previous
p. end, but there was one 80-100 deg. f. it, marking the position of the new
p. end of the NTD in Jan.
A
small, bright, anticyclonic Little Red Spot appeared in the NTD in late
Dec.(Fig.12). It originated as a
tiny white oval in the darkened latitudes of the NTZ at ~32 N. This interacted
with three short-lived small white spots prograding on or near the N2 jet, on
Dec.5 & 15 & 23; these spots did not survive.
During these mergers the NTD white oval became larger and dull fawn in
colour, then it became brighter and redder during Jan.
It also became more methane-bright (Fig.12): undetectable until Nov.29,
weakly methane-bright through Dec. (several images by Einaga), but strongly so
by Jan.28. Thus we have observed a new methane-bright LRS developing by
mergers of pre-existing smaller anticyclonic vortices. We have occasionally
recorded similar events in the past, including the reddening of NTropZ White
Spot Z last apparition.
Meanwhile
the NTB itself has been fading further: the NTB(S) is already almost
invisible, and the NTB(N) has also become very faint in sectors outside the
NTD.
N2
jet (NNTBs jetstream):
There
are still spots moving at DL2 ~ -80 deg/month, both inside and outside the NTD,
but most are now recorded as white spots, surrounded by dark material.
N2
domain:
NN-LRS-1
has lost its red colour since last apparition; it is stationary at L2 = 73,
almost invisible in the similar-coloured NNTZ, except in v-hi-res images; but
it is strongly methane-bright (Figs.3 & 12).
More conspicuous visually, but not methane-bright, is a small AWO which
has drifted (with oscillations) from L2 ~ 35 (2014 Sep.) to 17 (2015 Jan.).
This is WS-6 which has been tracked since 2010.
________________________________________
Figures:
Fig.1
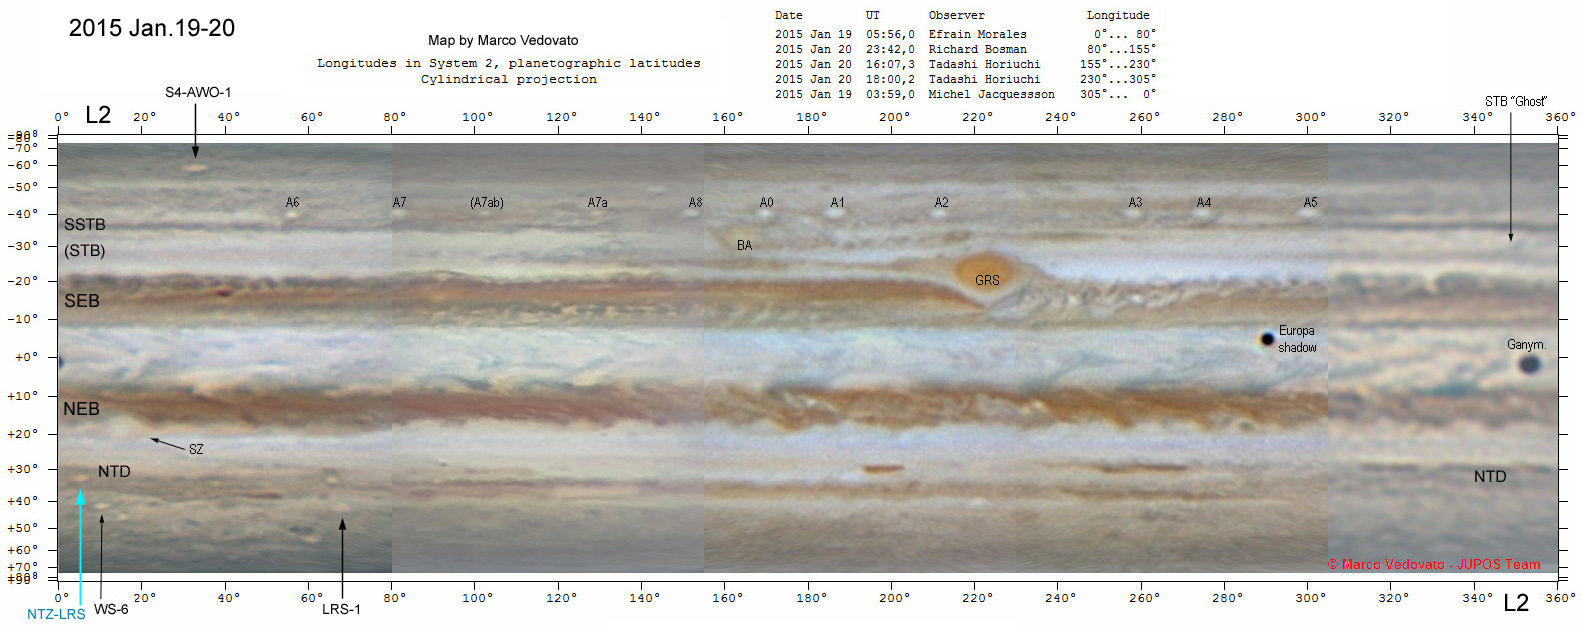
= Map of the planet, 2015 Jan.19-20, with features labelled.
South is up in all figures.
Fig.2
= Set of some of the best images, 2014 Dec., covering oval BA and longitudes
p. it; all the long-lived anticyclonic ovals, and a few other features, are
labelled.
Fig.3
= Images in the methane band (889 nm), with colour images, Dec.1 and
Jan.25-28. Oval BA and NN-LRS-1
are strongly methane-bright, as
usual. White spot Z is only weakly
detectable, now that it has lost its red colour.
On Dec.1, the other methane-bright spot is in the disturbed NTZ
latitudes in the NTD, apparently a small white spot in the N2 (NNTBs) jet
which may have been lost in a transient anticyclonic eddy on this date (L2 =
40). A similar interaction further
p., later in Dec., gave rise to the similar methane-bright spot seen on
Jan.28, which was a bright Little Red Spot (see Fig.12).
Fig.4
= The Great Red Spot: 3 of the best images resolving grey streaks circulating
within it.
Fig.5
= JUPOS chart: S3 & S4 domains, showing long-lived AWOs, etc.
Fig.6
= JUPOS chart: S2 (S.S. Temperate) domain, showing long-lived AWOs, etc.
Fig.7
= JUPOS chart: S1 (S. Temperate) domain.
Fig.8
= JUPOS chart: N1 (N. Temperate) domain.
Fig.9
= STBn jet spots: JUPOS chart, and images of the main volley, highlighting the
most persistent spot which passed the STB Ghost.
Fig.10
= Maps of the northern hemisphere, 2014 March-Nov.
Labels indicate Spot Z, NN-LRS-1, and major dark features of the N.
Temperate domain.
Fig.11
= Maps of the northern hemisphere (continued), 2014 Nov. to 2015 Jan.
Fig.12
= Images showing small anticyclonic spots in the N. Temperate domain, 2014
Oct. to 2015 Jan., including methane images.
A tiny AWO in the NTD merges with 3 successive prograding white spots
on or near the N2 jet, and evolves into a methane-bright Little Red Spot.