ASTEROID
LIGHTCURVES – PART I
1.0
Introduction
1.1 What is a lightcurve ?
A lightcurve is a chart showing variation in magnitude (y axis) with time (x axis). Examples can be found on the web sites listed in table 2.4 below.
1.2 Why asteroid lightcurves are important
A number of reasons for participating in a project such as this are spelt out in the CAPS guide mentioned in 2.2 below. To quote, they are;
1. To help determine a correlation between
rotation period and size, spectral class, location in the asteroid belt, etc.
2. To find, if any exist, asteroids with a
period of < 2.25h above 100m. There are several asteroids smaller than 100m
with periods < 2.25h, some as short as a few minutes. These asteroids are
almost certainly not "rubble piles" but of solid composition.
3. To find "slow rotators." These are
asteroids with periods of days and even months. A new theory has been proposed that
may explain the reason some asteroids have such long rotation periods but more
data on more objects is needed.
4. Long term studies of a given asteroid can
result in determining the phase coefficients, i.e., the absolute magnitude and
slope parameters that define the asteroid’s brightness – especially near
opposition when the "opposition effect" causes the asteroid to
brighten faster than at larger phase angles.
5. Obtaining lightcurves over several months at
a given apparition and repeating the process at several apparitions allows the
determination of the rotation axis orientation and even the shape.
6. Also allowing shape determinations are
observations during an occultation, when the asteroid passes in front of a
star.
7. Observations can be taken at the same time
as radar observations to allow a better determination of the size, shape, and
nature of the asteroid. Such efforts have discovered or helped confirmed
several binary asteroids.
8. Remove the observational bias towards
brighter main belt asteroids. While lightcurves have been obtained for about
1000 asteroids, that leaves a mere 100,000+ to go. The more complete the
sampling of asteroid lightcurves, the better astronomers can develop theories
concerning the origin and dynamics of the minor planet system.
9. Direct support of professionals who are
developing theories on specific aspects of the asteroids.
1.3 The Project
Richard Kowalski is the Association of Lunar and Planetary Observers (Minor Planet Section) Acting Assistant Coordinator for Near Earth Objects. He has devised a new photometry project - ‘The ALPO Near Earth Object Photometry and Shape Modeling Program’. Additional papers describing the program in more detail and including how to make and submit observations are listed at the bottom of that page. In outline the project links amateur and professional astronomers in determining shapes and rotational periods of asteroids from CCD and radar observations.
2.0
Reference
material
In addition to the documents listed below there are a number of books on the topic of CCD astronomy listed in the ‘Books’ section of this web site.
2.1
Photometry
The basics of CCD photometry can be found in the ‘Tools and Techniques’ section of this web site under the heading ‘Photometry’.
2.2
CALL Guide
to Minor Planet Photometry
The purpose of the Collaborative Asteroid Lightcurve Link (CALL) is ‘to allow those engaged in determining asteroid lightcurve parameters to coordinate their efforts so that the best use of observing time can be made’. Their guide to getting started with measuring asteroid light curves can be accessed here.
2.3
An
Introduction to Astronomical Photometry Using CCD’s
The above
document, in PDF format, was derived from the lecture notes of
2.4
Web sites
The table below lists webs sites that hold photometric data. Observers may find such data helpful in validating the accuracy of their own results. Some sites also list observing guides and software packages.
|
Go to |
Web site |
Data held |
|
|
Parameters |
|
|
European Asteroid Research Node |
Parameters |
|
|
Collaborative Asteroid Lightcurve Link |
Guides, Parameters, Targets |
|
|
Minor Planet Observer |
Software, Guides, Parameters, Lightcurves |
|
|
Ondrejov NEO Photometric Program |
Parameters, Lightcurves |
|
|
|
Models of asteroids from photometric data |
|
|
Santana Observatory |
Lightcurves, observations |
|
|
Sunflower Observatory |
Lightcurves |
|
|
AUDE |
Lightcurves |
|
|
|
Lightcurves |
The Minor Planet Bulletin is now on-line at http://www.minorplanetobserver.com/mpb/default.htm
Papers relating to asteroid photometry (and other astronomical subjects) can be found by searching the NASA Astrophysics Data System
A photometry reference file (2.8Mb) listing accurate magnitudes for around 33,800 stars can be found at;
ftp://ftp.lowell.edu/pub/bas/starcats/loneos.phot
A zipped version (700Kb) can be found at;
ftp://ftp.lowell.edu/pub/bas/starcats/loneos.phot.gz
A reference file (128Kb) listing sources of photometry used in the above files can be found at;
ftp://ftp.lowell.edu/pub/bas/starcats/loneos.ref
The Sloan Digital Sky Survey Moving Object Catalog lists astrometric and photometric data for 134,335 asteroids.
3.0
An example -
582 Olympia Lightcurve
3.1
Introduction
In March 2003
3.2
Set-up
3.2.1 Temperature
The air temperature was noted immediately prior to taking the images and checked every 30 mins. It held fast at 40 deg F which was fortunate as any significant change (+/- 5 deg F) would have meant obtaining further sets of dark frames and flat fields.
3.2.2 Exposure Time
Images of the target and surrounding stars were taken to verify that the maximum pixel intensity was equal to or less than 50%. One minute proved to be a satisfactory exposure time.
3.2.3 FITS
FITS header data (asteroid number and name) was input and the sub-directory in which the images were to be stored named as the date eg; 130303. Images were to be saved in FITS format.
3.2.4 Dark Frames and Flat Fields
Five Dark Frames were obtained using the exposure time determined in 3.2.2 above.
Using the Light Bin test Flat Field images were obtained and the light intensity and exposure times adjusted to give pixel intensities of approximately 50% of maximum (0.4 sec).
Five Flat Dark Frames using the exposure time determined above (0.4 sec) were obtained.
Again using the Light Bin, five Flat Fields using the exposure time determined above (0.4 sec) were obtained.
If the scope has to be reversed (which entails removing and replacing the CCD camera) or the temperature changes as described in 3.2.1 above this section would need repeating. The various dark frames and flat fields would then be identified by appending 1, 2, 3 etc to their file names and a note kept of which frames were applied to which images.
3.3 Calibration
I calibrated the asteroid images as I obtained them as this seemed to simplify the process in that this task would not have to be carried out later prior to the actual photometry. It also ensured that the correct darks and flats were applied to the raw images if temperature changes, for example, had required new sets to be taken. However having since received advice to the contrary and realizing that Multiple Image Photometry using AIP4WIN (and Astrometry using Astrometrica) will allow this operation to be performed ‘on the fly’ when processing images I have decided against it. I usually take the calibration images at the end of the observing session.
3.4 Imaging
3.4.1 Position verification
The position of telescope was checked by taking test images as it may have moved during 3.2.4 above.
3.4.2 Guided imaging
The Starlight Xpress STAR self-guiding feature was used in obtaining the images of the asteroid. A saved image and the air temperature were checked after each 10 images had been obtained.
3.4.3 At the end of the day (or night)
The calibration frames and images were saved to CD for later processing.
3.5 Processing
The Multiple Image Photometry facility in AIP4WIN was used to
calculate the magnitude of the asteroid. The results were then imported in to
Excel and a lightcurve, as shown below (for the13th March), constructed. V is the Variable (asteroid), C
is the Comparison star and K is the Check star. The results for all three evenings were sent to
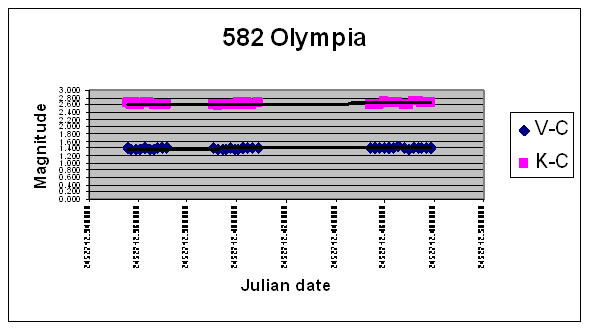
The time from start to finish was approximately three hours. The breaks in the chart were due to a need for refreshment and to put on an extra sweater and having to reverse the scope and acquire the necessary dark frames and flat fields at that time.
Little variation is obvious but it would appear that the total peak to peak variation is of the order of 0.4 magnitudes with a period of 72 hours. The complete light curve and other information can be found on David Higgins’ web site.
3.6 Conclusions
As mentioned in 3.3 above calibration should not be performed as the images are obtained but later when they are processed. This ensures the original raw images are preserved.
The air temperature must be monitored and, if any significant variation (+/-5 deg F) is noted then further sets of calibration frames must be obtained.
It is worthwhile checking a sample of data manually when moving it between applications and/or performing calculations. For example I found that somewhere between AIP4WIN and Excel the Julian date had got ‘mangled’ and required correcting.
I now have a set-up, imaging and processing procedure that I can use in future. All I have to do now is find an asteroid that has a short rotation period (ideally six hours or less), a large magnitude variation (> 0.5 mag), a warm, clear, haze free and Moonless night and summon up the energy to stay awake from dusk to dawn. Not much to ask for really !?!