from VSSC91
44 Bootis is a triple system, of which the fainter component (B+C) is the nearest example of a W UMa type eclipsing binary. 44 Bootis is also known as i Bootis (not to be confused, as has sometimes been done, with iota Bootis !). Confusion as to the star's identity also seems to extend to the 4th edition of the GCVS, in which the eclipsing component BC carries the label ZZ Boo. However, the GCVS lists two (!) objects with the label ZZ Boo, the other being an EA type binary with a period of 4.99 days. Since it is the latter which occupies its correct position (between YZ and AA) in the catalogue, I assume that 44 Bootis BC acquired the label ZZ in error. The GCVS gives the range of BC as 5.8-6.4; however, observation is hindered by the proximity of the brighter A component, which during this century has never been more than 2.5 arcseconds distant. If the light from A+B+C is measured together -as is usually the case - the total range is only 0.17 magnitudes. (All subsequent references to the light variation in this article will refer to the combined light of the system (A+B+C)).
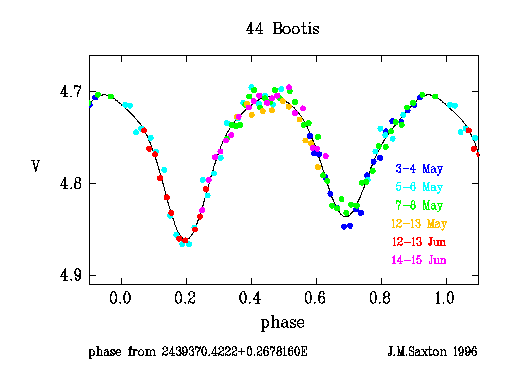
Figure 1

It is noteworthy that the light curve is essentially symmetrical, and that
the maxima are of equal brightness (to +/- 0.01 in V). This has not always
been the case, since 44 Bootis, like many W UMa stars, has a lightcurve which
can vary in shape; the variations have been attributed to large starspots
whose extent varies with time. For example, Hopp and Witzigmann (1982)
observed the system on 10-11 April 1979, and found the two maxima to differ
by approx 0.05 in V. Eggen (1948) reported observations made in 1930 which
showed the two maxima to differ by approx 0.03 mag.
The positions (in phase) of the minima were derived from figure 1, by fitting
quartic polynomials to the data from phase 0.1-0.3 and from 0.6-0.8.
1s errors were estimated by a Monte-Carlo method: the r.m.s. scatter from the
best fit curve was noted, and then 1000 'synthetic' light curves generated in
which the points were normally distributed about the best fit curve by an
appropriate amount. For each synthetic curve the phase of minimum was noted
by re-fitting a quartic polynomial, and the standard deviation of the 1000
synthetic minima phases was taken as the error. Parabolic and cubic fits
produced the same minima phases within error. The derived minima phases have
been converted into equivalent times (HJD) for two (arbitrary) minima in
mid-May, and listed in the table below.
| Min | HJD |
|---|---|
| I II | 2450216.219 +/- 0.002 2450216.353 +/- 0.003 |
A detailed study of eclipse timings of 44 Bootis was made by Hill et al (1989). They considered astrometric, radial velocity, and eclipse timing observations. Their paper contains a list of over 300 eclipse timings assembled from various sources and dating back to 1916. If the eclipsing component 44 Boo BC were a perfect 'clock' (i.e. had a stable period) then eclipse timings would allow us to study the system in the third dimension (at right angles to the plane of the sky), owing to the varying light travel time as A-BC orbit each other. The visual orbit does yield the inclination, but in order to relate the visual orbit to light travel time, it is necessary to know a scale factor which depends on both the distance to the system (which relates angular measure on the sky to absolute length) and also the position of the barycentre between A and BC (mass ratio (mA+mBC)/mBC). (The masses can actually be derived from the radial velocities and Kepler's laws, which leaves the system parallax (distance) as the unknown). Hill et al were able to estimate this scale factor by finding that a good fit exists between a scaled orbit and the observed eclipse timings from 1916-1965 (this also implies that intrinsic period changes in component BC were small -compared to orbital light-time changes -during this interval). A large intrinsic period change ocurred about 1967. Radial velocity of the barycentre of the system, which is constant, has been ingored: this is justified since our aim is to discover and understand changes in orbital period, both apparent and intrinsic, of component BC.
I have reanalysed all eclipse timings available to me, using the orbit and scale factor from Hill et al A total of 377 timings from 1916-1996 is presently avalailable: 312 from the compilation by Hill et al, 3 by A. J. Hollis and reported in VSSC 61, two from the J Ells APT and reported in VSSC No. 81, the two reported in this note, with the remainder being obtained from Oprescu et al (1991, 1996).
Figure 2
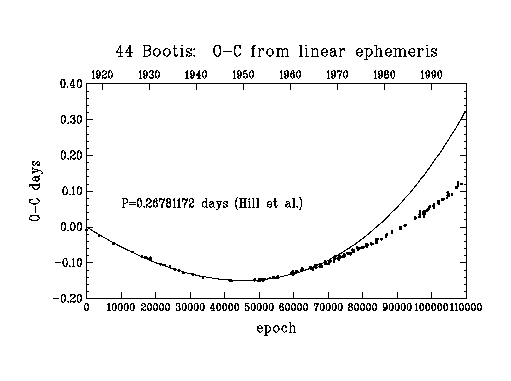
Figure 2 shows the O-C values versus orbit number (or time) with the computed times derived from a simple linear ephemeris. The solid line shows the O-C (relative to this linear ephemeris) which would be expected given the orbit and scale factor refered to above. It is quite clear that a significant portion of the variation in O-C is due to the orbital motion of A-BC. You can see the good fit from cycles 0-67000 (which enabled Hill et al to derive the scale factor) and that the fit becomes worse after this date.
Figure 3
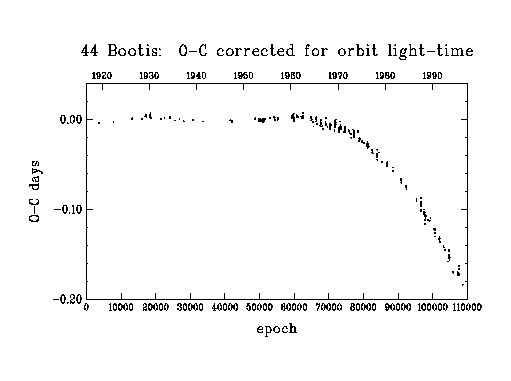
In figure 3, I show O-C where the computed times are now from a model which includes the linear ephemeris used for figure 2 and also a correction for orbit light-time. Remember that in a plot of O-C versus cycle number, a straight line of non-zero slope just means that the assumed period is wrong. From examination of a diagram of this form, Hill et al deduced that the period had changed several times since 1916; they derived separate periods for intervals 0-20000, 20000-40000, 40000-67000 and 70000-79000 (data from 67000-70000 were excluded owing to the large scatter). Effectively, this procedure considers figure 3 as a series of straight line segments. So, the next improvement in the model is to have different periods for the above intervals, as well as including the effects of orbit light-time.
Figure 4
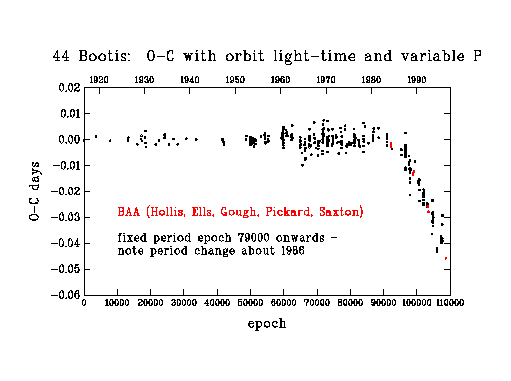
In figure 4, I show O-C's from such a model; however, the ephemeris (period and epoch) derived for the interval 79000-93000 has been used for all data after 79000. It is immediately obvious that a significant period change took place about 1986, amounting to -11 parts per million (shortening of period). In figure 5, I show O-Cs from a model which includes an appropriate ephemeris for cycles >93000. The scatter of O-Cs about zero in figure 5 for cycles >93000 is still, perhaps, more than might be expected from the accuracy of the eclipse timings. A possible explanation for this increased scatter is that some of the eclipse light curves are distorted by the presence of star spots.
Figure 5
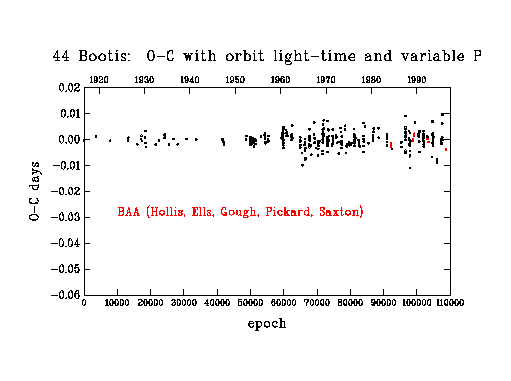
The 1986 period change is the largest yet observed for 44 Bootis. The total
change in the late 1960's was -7 ppm and in 1974 -9 ppm. The period appears
to have remained more or less constant from 1986 to the present.
Considerable confusion exists in the literature concerning 44 Bootis period
changes since many authors have ignored the orbital motion of A-BC. Said
another way, the orbital period observed from Earth is not generally the
same as the true (intrinsic) period of 44 Bootis BC.
Consequently, many of the reported period changes are spurious.
It is indeed possible (and convenient) to use a linear ephemeris to predict
eclipses over a short time interval, but orbital motion must be taken into
account if eclipse timings are to be compared over a long time interval.
Oprescu et al (1991) did indeed report a period change in 1986, but gave it
as about +4 ppm; it has been shown here that once orbital motion is
considered, the intrinsic period change is about -11 ppm.
It is perhaps appropriate to finish by emphasising that, despite the small amplitude (about 0.17 in V), 44 Bootis does display a range of phenomena - such as changes in orbital period and distorted light curves - which are accessible to observers who can make observations of sufficient precision. The star can be commended for further study.
Hollis A. J.,
Photoelectric photometry at Marton Green Observatory - A retrospective of a decade's work', JBAA, 105, 17 (1995).
Hill G., Fisher W. A. and Holmgren D.,
Studies of late-type binaries I.- The physical parameters of 44i Bootis ABC,
Astronomy and Astrophysics, 211, 81 (1989).
Hopp U. and Witzigmann S.,
BV photometry of the W UMa star 44i Bootis,
Astrophysics and Space Science, 83, 171 (1982).
Oprescu G., Doru Suran M., Popescu N.,
IBVS, No. 3560 (1991).
Oprescu G., Dumitrescu A., Rovithis P. and Rovithis-Livaniou H.,
IBVS, No. 4307 (1996).
Ells APT, quoted in VSSC 73, pp13-25.
E W Burke, R A Fried, D S Hall, M Casado, M Hampton and M Hunt, IBVS 3722 (1992).
P Rovithis, H Rovithis-Livaniou, G Oprescu, A Dumitrescu and D M Suran, IBVS 3950.
R A Jones IBVS 3799
O Gherega, L Farkas, A Horvath, IBVS 4045.
This work has made use of the SIMBAD database, operated by CDS at Strasbourg, France.