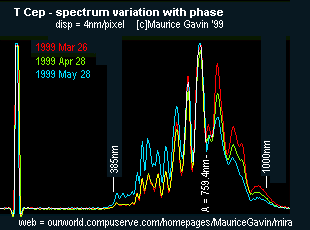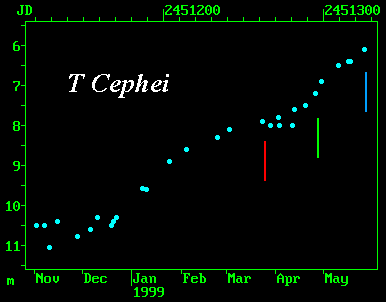

 | A composite of three spectra obtained over three months. From March there is a steady decline of IR radiation [to the right of line A] and a marked increase in visible at the end of May when T Cep was near maximum and the spectrum could be snapped in 1s exposure. Note the April 'lag' in the 400-450nm region - remaining much the same as in March. |

|