[7]
The
accelerating circulation of the Great Red Spot.
We published a paper with this title based on images taken in 2006
[ref.1]. Now, recent images again allow the GRS circulation to be traced, and
show that it has continued to accelerate. The attached compilation is from
the image sets that were just posted in Report no.6. There is a dark
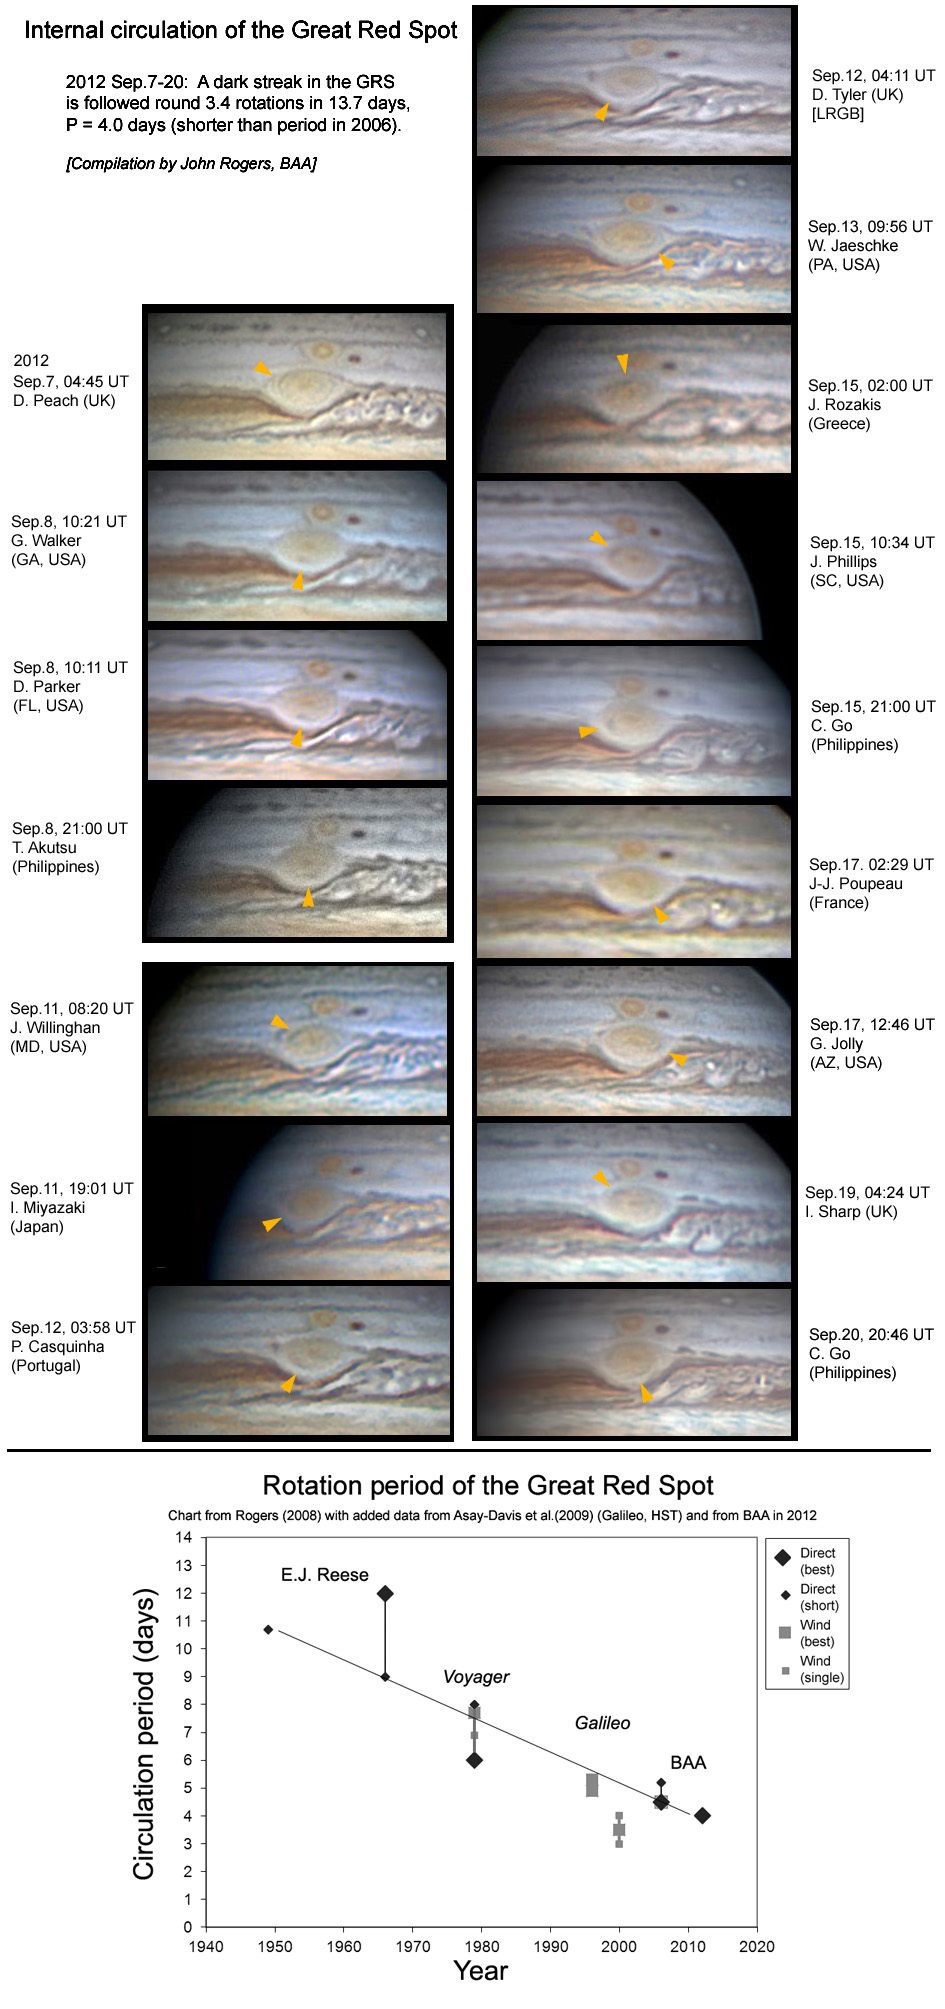
streak circulating within the GRS, indicated by a yellow arrowhead. Note
how it returns to the same position on the mornings of Sep.7,11,15,19. It
is tracked 3.4 times around the GRS in 13.7 days, giving a rotation period of
4.0 days (+/-0.1 day).
This period is significantly shorter than the period we established in 2006 (4.5
days). The GRS has not shrunk much in the meantime, but our deduced wind
speed has increased from ~112 to 135 m/s [see footnote]. Although we
cannot be certain that any feature visible from Earth is moving with the maximum
wind speeds, the periods we observed in 2006 and 2012 agree well with the trends
from spacecraft [ref.2]. The rotation period, as shown in the chart, is
diminishing at about the same rate as the radius of maximum wind speeds, as
determined by spacecraft [ref.2]; the outer radius of the GRS is shrinking at a
rather slower rate. The maximum wind speeds fluctuate in spacecraft data,
and do not show a clear trend. We can conclude that the speeding up of the
circulation period is due mainly to contraction of the circulation itself, and
that this trend is still continuing this year.
It is amusing to note that the GRS now has exactly the same circulation period
and the same north-south diameter as the atmosphere of Venus.
John Rogers,
2012 Oct.30.
- - - - - - -
Footnote:
The length of the GRS (major axis of the oval, ignoring the variable grey collar
around it) in 2012 Sep. appears to be ~16-17 deg., though the edges are not very
distinct; the average of measurements by the JUPOS team is 14.5 deg. A
more precise value can be obtained from images in late 2011, as the internal
diameter of a uniform dark collar: 16 deg, or 15.4 deg from JUPOS measurements.
Here I adopt 16 (+/-1) deg. as the present length. Note that this is not
significantly shorter than in 2006.
The wind speed is calculated by adopting a length of 16 deg = 18560 km, assuming
a constant N-S width of 10.3 deg = 12400 km, noting that the dark streak is at
~80% of the radius of the GRS, and using the same formula as in ref.1; thus we
obtain a maximum speed of 135 m/s. This is significantly faster than the
value of 112 m/s we found in 2006 [ref.1], but agrees with the values of 118-132
m/s reported from HST images in 2006 [ref.2].
- - - - - -
References:
[1] Rogers JH (2008) JBAA 118, 14-20:
http://www.britastro.org/jupiter/JBAA-118-1_GRS-paper.pdf
[2] Asay-Davis XS, Marcus PS, Wong MH & de Pater I (2009) Icarus 203,
164-188.
- - - - - -
Illustration:

Top: Set of images of the GRS in 2012 Sep., from the same images
that were posted in report no.6. There is a dark streak circulating within
the GRS, indicated by a yellow arrowhead. Also note oval BA, a similar but
smaller anticyclonic red oval, passing the GRS to the south. South is up.
Bottom: Chart showing all determinations of the GRS rotation
period, as in ref.1, plus data derived from ref.2, and our latest result.
Diamonds represent direct measurements of the period (large points, over several
rotations; smaller points, over shorter intervals); squares represent periods
calculated from maximum wind speeds observed from spacecraft (large points, from
best fits; smaller points, from single values). Apart from the value from
Galileo on 2000 May 22 (when the wind speed seems to have been anomalously
fast), there is a linear trend to shorter rotation periods.
_________________________________
John H. Rogers, Ph.D. Jupiter Section Director,
British Astronomical Association
jhr11@cam.ac.uk
http://www.britastro.org/jupiter/