[3] The NTBs Jet in 2007 and 2008: Evidence on the structure of the jet and the nature of global upheavels.
John
Rogers,
British
Astronomical Association
Last
year’s dramatic outbreak of the NTBs jetstream, displaying the super-fast
speed that we call North Temperate Current D (NTC-D), was extremely similar to
the last such outbreak, in 1990, but was even better observed by ground-based
amateur imagers and by the Hubble Space Telescope (HST). Here
I report a new observation which seems to extend the parallels between them and
to provide much better temporal and spatial resolution of the return of the
jetstream to its more normal state. The
observation is the presence of faint, narrow ovals (‘lozenges’) on the NTBs. These may be incipient anticyclonic ovals, i.e. jetstream
vortices, such as appeared 21 months after the 1990 NTC-D outbreak with the
standard speed that we call North Temerate Current C (NTC-C) [footnote 1]. This time
they have been detected only 11 months after the 2007 NTC-D outbreak, with a
speed intermediate between NTC-D and NTC-C. The rapidity of this change supports
a model in which the jetstream has a permanent NTC-D speed below the cloud-tops,
but the cloud-top wind speed alternates between the NTC-D speed (when outbreaks
driven from below are frequent) and NTC-C speed at other times (sometimes, or
perhaps always, when jetstream vortices are present).
Between
1991 and 2002 the NTBs carried a set of 7 stable jetstream vortices with a
virtually constant speed of DL1 ~ -60 deg/mth (u3 = 125 m/s), and the
peak jet speed alongside them was 135 m/s; this state comprises NTC-C. (See
Rogers et al., 2006, & refs. therein.) The parameters of the 1990 and 2007
NTC-D outbreaks, and of the NTBs jet as observed before and after the outbreaks,
are listed in Table 1. These data are from the amateur observations (my book, &
JUPOS charts for 2007, and the present observations). Sanchez-Lavega et al.(2008) report much the same results from
the amateur images, and also analyse HST images, showing that the latest
outbreak actually began on 2007 March 25, and measuring the latitudinal profile
of the jet on that date and again in June.
New
observations:
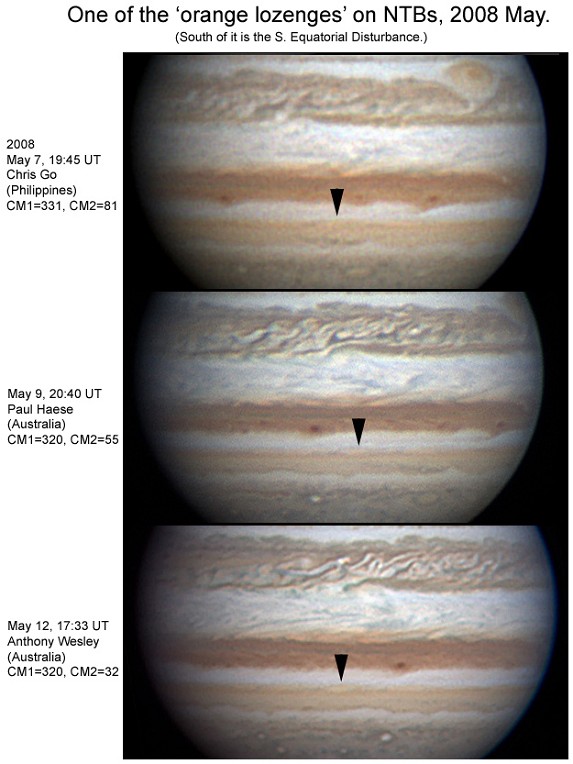
The
2007 outbreak led to the revival of a prominent orange NTB(S), which is still
very strong. In 2008, the NTBs edge carries at least 6 pale orange
lozenges, each about 8 deg. long (Figure
1). Measurements on 3 of them
give speeds as follows (DL1, deg/month):
-80
(+/-4; May 2-15); -78 (+/-6; May 3-13); -60 (+/-15; May 7-13).
Thus
we can adopt a consensus speed DL1 = -78 (+/-6) deg/mth (u = 133 m/s).
They
developed during solar conjunction: at least some were present, with similar
speed, in the earliest adequate images of the year (by A. Wesley on 2008
Feb.25-26).
This
observation is relevant to two questions that arose after these outbreaks.
In
both 1990 and 2007, dark patches with DL1 ~ -25 deg/mth appeared during the NTC-D
outbreak with speeds of ~-25 deg/mth, close to NTC-C, so it was conjectured that
these might have developed into the jetstream vortices.
However this seems unlikely. In
each outbreak, the dark patches ceased to be visible as the NTB revived as a
smooth featureless belt, before the NTC-C vortices appeared. Thus
in the 1990/91 apparition, no such spots were visible. In
2007, we were able to study the evolution of the dark patches with much better
images: they never developed anticyclonic forms, and all but one of them
disappeared before the end of the apparition, as the smooth reddish NTB
stabilised. The lozenges in 2008
seem to be new objects, with a different shape and a faster speed.
It
is likely that they have been seen sooner after this outbreak only because of
the much better quality of the images. They
still have very low contrast. I
suggest that they are still developing, and within a year they may show a more
compact form, and greater visibility (depending on the evolving cloud cover of
the NTB) and slower speed (typical NTC-C).
Implications
(2) How deep does the NTBs jet extend?
Historically,
the NTBs has alternated between ‘NTC-C’ and ‘NTC-D’ states (book
pp.106-110). Only NTC-C spots were seen from 1891-1943, and from
1991-2002. Conversely NTC-D outbreaks were seen in 1880 and every 5 years from
1970 to 1990 [footnote 2], distinguished
by superfast speeds, brilliant white spots, and subsequent orange colour.
These states were confirmed by spacecraft measurements of the peak wind
speed of the jet between outbreaks: NTC-D in 1979 (Voyager) and NTC-C in
1995-2000 (HST and Cassini). The question thus arose:
Did the whole NTBs jet change its speed between these states?
Or were the changes confined to the cloud-top level?
There
is already evidence that the change is confined to cloud-top level, with the jet
extending much deeper with permanent NTC-D speed (at least 170 m/s).
The main evidence is adduced by Sanchez-Lavega et al.(2008):
1)
Modelling the white plumes that move with NTC-D suggests they arise by
convection from well below the visible clouds;
2)
Modelling the whole outbreak indicates that NTC-D white plumes and NTC-C
vortices can arise only if the jet extends deep with a permanent speed at least
as fast as NTC-D;
3)
It is implausible that a deep jet could change its speed as rapidly as observed.
Our
new observations add further weight to this last point, since the jet appears to
be returning to a NTC-C state only 11 months after the latest NTC-D outbreak.
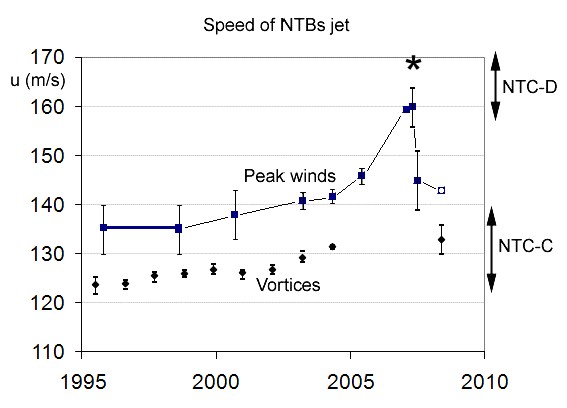
Indeed it is possible to compile a detailed record of the change in the peak cloud-top jet speed before and after the 2007 outbreak (Table 2 and Figure 2). This is the speed of small cloud tracers, not plumes nor vortices. It starts with the stable NTC-C state that prevailed up to 2002 (135 m/s: HST, Cassini). Then from 2002 to 2005, as the vortices disappeared, JUPOS analysis of amateur images was able to track gradual acceleration of the jet itself (Rogers et al., 2006). In 2007, the jet was fortuitously tracked by New Horizons in Jan. (159.5 m/s: Cheng et al.,2008), and by HST on the day the outbreak appeared (160 m/s), and 3 months later (145 m/s) (Sanchez-Lavega et al., 2008). The present speed of the jet can be estimated as 143 m/s if we assume that the orange lozenges are indeed jetstream vortices and that the peak jet speed is 10 m/s faster, as it was before the outbreak.
The
present model of the NTBs jet can therefore be outlined as follows. There is a
permanent deep jet with a speed of at least 170 m/s, but its surface expression
alternates between two stable states. In
the NTC-C state, jetstream vortices develop (as on other jets) and limit the
speed of the jet; I conjecture that they must be shallow structures, and when
fully developed they impose a strict limit of ~135 m/s on the speed (presumably
determined by the maximum stable wind shear and the width of the jet and the
vortices). When the vortices broke
up after 2002, the jet at cloud-top level was free to accelerate towards the
faster speed maintained at deeper level, reducing the vertical shear (Rogers et
al., 2006). Only when this
acceleration passed a critical threshold, was it was possible for a deep
convective storm to erupt all the way to the cloud-tops in the form of the
brilliant plumes moving with NTC-D (Sanchez-Lavega et al., 2008).
From 1970 to 1990, this NTC-D state was maintained continuously; but
after 1990 and 2007, the cloud-top speed decelerated again within months,
allowing NTC-C vortices to re-establish themselves.
The
trigger for the deep convective storm may have been a global one, which is not
understood but manifests in the global upheaval (book p.249-252), in which the
NTBs jet outbreak and the SEB Revival outbreak are both typical components.
Now we can see surprising similarity between these two outbreaks.
Both start with a convective upsurge which can rise up from a deep level
(probably the hypothetical water cloud layer) only when special conditions
prevail in the cloud-top layer. But
there is still a remarkable difference betwwen them, that the NTC-D outbreak is
in the peak of the fastest jet, whereas the SEB outbreak is in a slow-moving
belt.
The
now-well-established pattern of NTC-D outbreaks also sharpens the definition of
the global upheaval (book p.250). A
NTBs spot outbreak is one of the most important elements in a global upheaval,
but was thought to begin within a wide range of time, more than a year after the
SEB Revival outbreak. But as we
update our review of global upheavals to 2007, we now see that most of them
involved a NTC-D outbreak, which often occurred within just months before or
after the SEB Revival outbreak (1970, 1975, 1990, 2007). In contrast, two
‘classic’ global upheavals (1928-29, 1938-39) now look unusual in that the
NTBs outbreaks displayed NTC-C only and started more than a year after the SEB
Revival outbreak. I wonder if
these, like the recent NTC-C outbreaks, were actually triggered about a year
earlier, by an event unobserved during solar conjunction [Footnote 3].
So we can now see that the SEB Revival outbreak and the NTBs jet outbreak
typically occur much closer in time than was previously thought.
Conclusion:
Observers
can conclude that hi-res images over the next year or two will be of great
value, to test the predictions made above: namely that the orange lozenges will
develop into distinct vortices and decelerate to the standard NTC-C speed (DL1 ~
-60 deg/mth). If this does not occur, the present observations have nevertheless
provided a valuable measurement of the NTBs jetstream speed at a unique
time-point in the aftermath of a NTC-D outbreak.
References:
[See
these papers for earlier references. ]
Rogers
JH, Mettig H-J & Peach D (2006) Icarus
184, 452-459. Renewed acceleration
of the 24 deg.N jet on Jupiter.
Sanchez-Lavega
A et 24 al. (2008 Jan.24) Nature
451, 437-440. Depth of a strong
jovian jet from a planetary-scale disturbance driven by storms.
Cheng
AF et al (2008 June) Astronomical Journal 135 2446-2452. Changing
characteristics of Jupiter's Little Red Spot.
Footnotes:
[1]
North Temperate Currents A,B,C,D refer to different speed ranges.
For completeness: NTC-B (intermediate between Systems 1 and 2) refers
to ‘rifts’ in the NTB, often seen 1-2 years after a NTC-C or –D outbreak.
NTC-A (DL2 ~ +17 deg/mth) is the permanent slow current of the NTB and
NTZ.
[2]
This 5-year interval assumes that an outbreak occurred during solar
conjunction in early 1985; no spots were seen but the region showed a vivid
orange colour during the 1985 apparition.
[3]
However any such trigger for the 1929 and 1939 NTC-C outbreaks was
probably not a NTC-D outbreak in the manner of 1990-91 (and possibly 2007-08).
Even though a NTC-D outbreak could have been missed during solar conjunction, it
would have left reddish colour in the NTB, which was not present. Actually,
strong reddish colour was present in 1927, following a NTBs outbreak in 1926, so
that might have involved an unobserved NTC-D outbreak.
There was no such activity preceding 1939.
|
Table
1: NTBs outbreaks: comparison of 1990 and 2007 |
|
|
||
|
|
|
|
|
|
|
Increased
jet speed before outbreak |
Voyager,
1979: |
JUPOS,
2005: |
|
|
|
Speed
(u3) (m/s) |
182 |
146 |
|
|
|
Bright
plumes (NTC-D outbreak): |
|
|
|
|
|
Start
date |
1990
Feb.10 |
2007
Mar.27 |
[Mar.25
(HST)] |
|
|
Speed
(DL1) (deg/mth) |
-169,
-160 |
-162,
-154 |
|
|
|
Speed
(u3) (m/s) |
173,
169 |
170,
167 |
|
|
|
Dark
patches following: (DL1) |
-25 |
-21
to -51 |
|
|
|
Jetstream
spots (NTC-C outbreak): |
|
|
|
|
|
First
sighting after conj'n |
1991
Nov. |
2008
Feb. |
|
|
|
|
(21
months) |
(11
months) |
|
|
|
Speed
(DL1) |
-57 |
-78 |
|
|
|
Speed
(u3) |
124 |
133 |
|
|
|
|
|
|
|
|
|
|
|
|
|
|
|
Table
2: Measurements of peak speed of NTBs jet (u3, m/s): |
|
|
||
|
|
|
|
Clouds |
Vortices |
|
1996-2002 |
HST;
Cassini; JUPOS |
135 |
125 |
|
|
2003
Jan-Apr. |
JUPOS |
Rogers
et al.2006 |
141 |
130 |
|
2004
Feb-May |
JUPOS |
Rogers
et al.2006 |
142 |
132 |
|
2005
Mar-Jun |
JUPOS |
Rogers
et al.2006 |
146 |
|
|
2007
Jan |
NH* |
Cheng
et al.,2008 |
159.5 |
|
|
2007
March 25 |
HST |
S-L.
et al., 2008 |
160 |
|
|
2007
June 5 |
HST |
S-L.
et al., 2008 |
145 |
|
|
2008
May |
JHR** |
this
paper |
(143) |
133 |
Figure 2 and this Table are a
continuation of the chart in Rogers et al.(1996).
*I thank A. Cheng and A. Simon
for the exact figure from New Horizons (they note there is variation).
**The jet speed in 2008 is assumed to be 10 m/s faster than the drift rate of the putative vortices.
Fig01:
Fig02: