Jupiter
in 2000/2001
A
review of multispectral imaging of the jovian atmosphere
John
H. Rogers, Tomio Akutsu, & Glenn S. Orton
Summary
In 2000/2001, Jupiter was imaged
at more wavelengths more intensively than ever before.
This article reviews the data sets available, and reports on the major
features detected in them, especially a novel pattern of largescale waves over
the the North Equatorial Belt (NEB).
The images came from amateur
contributors, and from the NASA Infrared Telescope Facility,
and from the Cassini and Galileo spacecraft. Images were taken not only
in visible wavelengths, but also in the ultraviolet and in the near-infrared
methane absorption bands (all these wavelengths being sensitive to levels above
the main cloud layers); in near-infrared continuum bands (penetrating within the
main cloud layers); and in the mid-infrared thermal band (revealing emission
from below the cloud layers).
Polar hoods and anticyclonic ovals
were, as usual, among the most prominent bright features in the methane-band
images. These images also revealed major disturbances affecting the South and
North Equatorial regions. The South
Equatorial Disturbance, a solitary wave in the visible clouds, showed massive
disruption of the upper haze layers in the infrared (see Paper III of this
report).
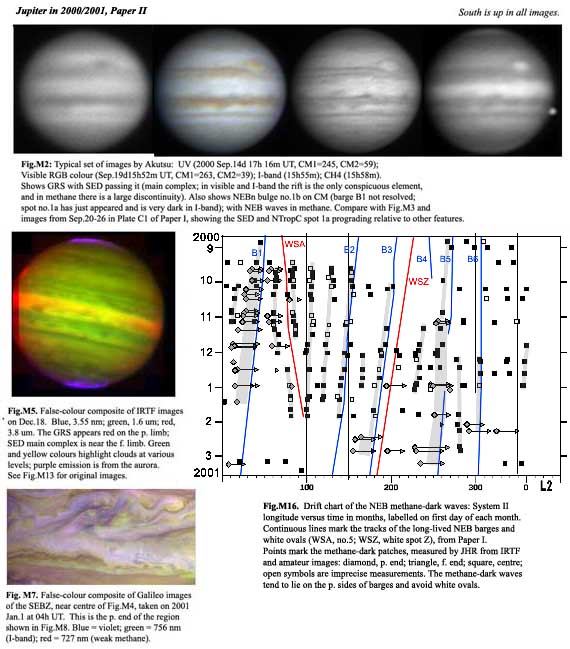
The NEB waves were a series of
large diffuse methane-dark patches, representing variations in the thickness of
high-altitude haze over the belt, with a 'wavelength' of 20-25 deg. longitude.
The most conspicuous of the patches were aligned with visible features,
particularly the p. sides of visible barges, where there was anticyclonic
eddying. Longitude measurements show that the waves moved at the same speeds as
the underlying visible features, i.e. in the range between System II and System
III, and anomalies in their motion were related to visible cloud events. There
was no sign of any phase speed that was different from the speed of the
underlying visible features. Therefore the waves were controlled by the
lower-lying tropospheric circulations.
These NEB waves in 2000/2001 may
have been a consequence of the ongoing NEB broadening event, and they became
indistinct just as the NEB broadening became complete. They had many
similarities to 'slow-moving thermal waves' reported by previous mid-infrared
observers, which were also most conspicuous when barges were present. We propose
that these waves are induced by the curving and eddying of the tropospheric NEBn
jetstream, and that they propagate upwards as warm waves which cause thinning of
the high-altitude haze as well as enhanced mid-infrared emission.
______________________________________________________________________________
Introduction
Jupiter has never been studied
with higher resolution and frequency than it was in 2000/2001, not only in the
visible waveband [ref.1], but also in other wavebands from the infrared to the
ultraviolet. Multispectral imaging was carried out by amateur observers, by
spacecraft, and by professional observatories. This great effort was partly due
to the unprecedented dual flyby by the Cassini and Galileo spacecraft [ref.2],
and partly due to the recent improvements in both amateur and professional
ground-based detectors. These
multispectral observations provide three-dimensional views of Jupiter's clouds,
giving new insight into the dynamics of the atmosphere.
In a previous report [ref. 3], we
reviewed the imaging of Jupiter in the near-infrared methane absorption band at
0.89 mm, which is
now being carried out by several amateur observers as well as by spacecraft.
In this report, we consider the imaging in all near-infrared (IR) and
ultraviolet (UV) wavebands during 2000/2001, reviewing the data sets available,
and describing the major features detected in them.
Feature numbers are taken from our report on observations in visible
light [ref.1, hereafter Paper I]. As
the planet was in a largely typical state, this will serve as a review of
multispectral probing of the jovian atmosphere.
Table 1 summarises the wavebands which have been accessed by different
observatories. Fig.1 shows
how they penetrate to different levels in the atmosphere, relative to the
various cloud layers presently believed to exist....
Data sets
General appearance of the planet
in multispectral images, 2000/2001
including discussions of SEBn/NEBs; NEB; and NPR
The wave pattern over the North
Equatorial Belt
Conclusion:
Thus, thermal waves over the NEB
are always present, but are most prominent when barges exist. The spacing and
motion of the warm waves is similar to that of the barges. They may be centred
over the barges or up to 20 deg. p. them; but sometimes there is no clear
relationship. Broadly, then, these properties are the same as those of the
methane-dark waves in 2000/2001, and we predict that the methane-dark waves will
be shown to coincide with warm waves at the 250-mbar level. A possible model is
that meanders in the NEBn jetstream, particularly where it curves around barges,
give rise to thermal fluctuations which propagate upwards and prograde, so they
may be centred 5-20 deg. p. the barge at the 250-mbar level, and 20-40 deg.
further p. at the 10-20 mbar level. The
variability in the spatial relationships could be because of the variable
spacing of the barges; possibly this constrains the angle at which the waves can
propagate upwards. However it may
also reflect the meteorological state of the NEB; thus in 2000/2001, as the NEB
broadening event became compete, the average length and periodicity of the
methane-dark waves underwent a rapid lengthening.
In conclusion, we believe that the 2000/2001 methane images do show the
thermal waves, and for the first time it has been possible to see their
structure clearly and track their motion precisely....
&&&&&
Note added
in proof [2004
March 5]:
The Cassini Composite Infrared
Spectrometer maps, showing global atmospheric temperatures on dates in 2001
January, have now been published [F.M. Flasar et al., Nature 427, 132-135
(2004)]. In the map at a level of
~243 mbar, the most striking features are 9 warm patches at ~15 deg.N, and 7 of
them correspond to the methane-dark patches reported here. The
two largest warm areas coincide with the two largest methane-dark
patches (p. barges B1 and B5), and 5 other warm spots all map 3-4 deg. p. the
longitudes of other methane-dark patches One interesting exception is a warm spot at L3 = 185 which coincides with
white spot Z, suggesting that a methane-dark patch either did not form here or
was less visible because of the underlying bright oval.
In the Cassini map at a level of ~1 mbar, the only persistent features at
this latitude are two large, very warm areas centred ~20 deg. p. the two largest
methane-dark patches (p. barges B1 and B5).
Each of these has a warm 'tail' extending Nf. and there are indications
of warm spots or waves spreading Nf. along these tails at ~1-2 deg/day.
Thus the Cassini maps not only suggest a ~20 deg. offset due to vertical
propagation of the waves (agreeing with that observed by the IRTF in 1988), but
also suggest complex dynamics in the stratosphere.
Web pages maintained by the BAA Jupiter Section Staff.